Regions, countries and metro areas
Where the meeting's first authors are, and talk rate by world region, country and metro area.
Center of mass
Where the first authors are, on average: the geographic midpoint of every first author's metro area, year by year (an abstract with first authors in several metros counts a fraction in each). It spans every year, so the year toggle below applies only to the sections after it. The center follows the meeting: local groups bring extra abstracts to a home meeting.
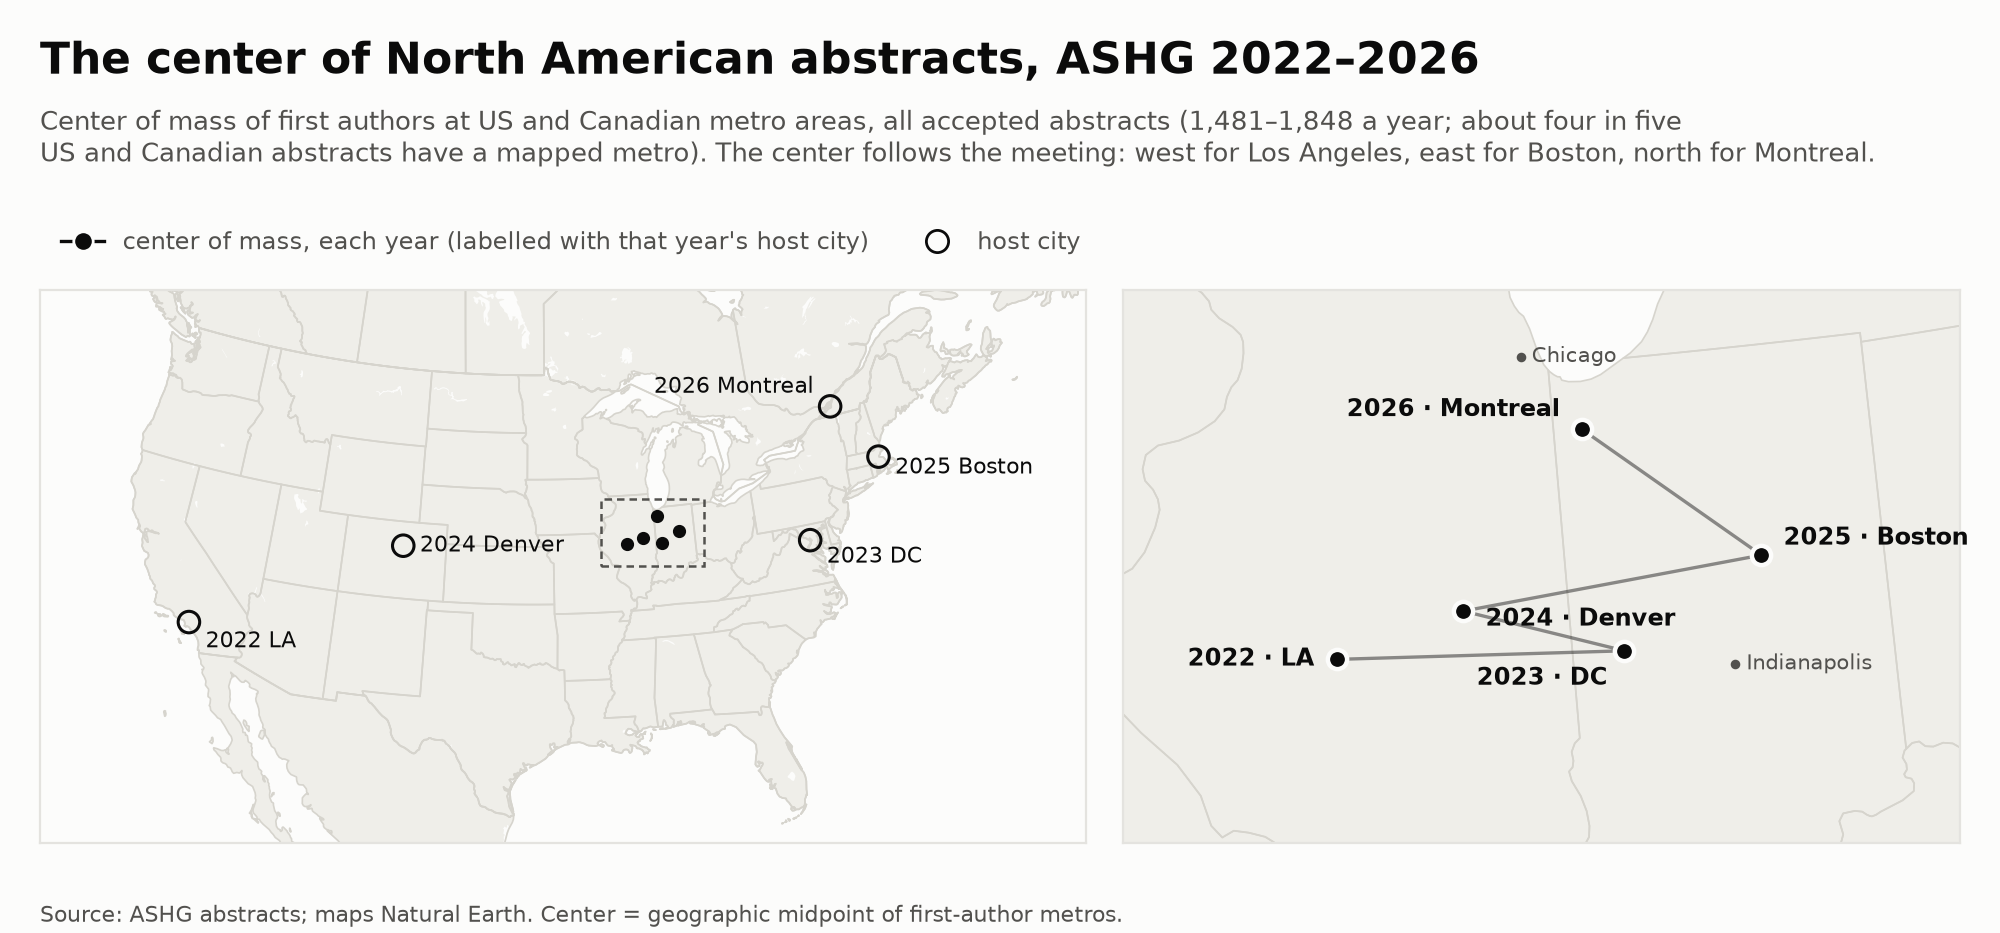
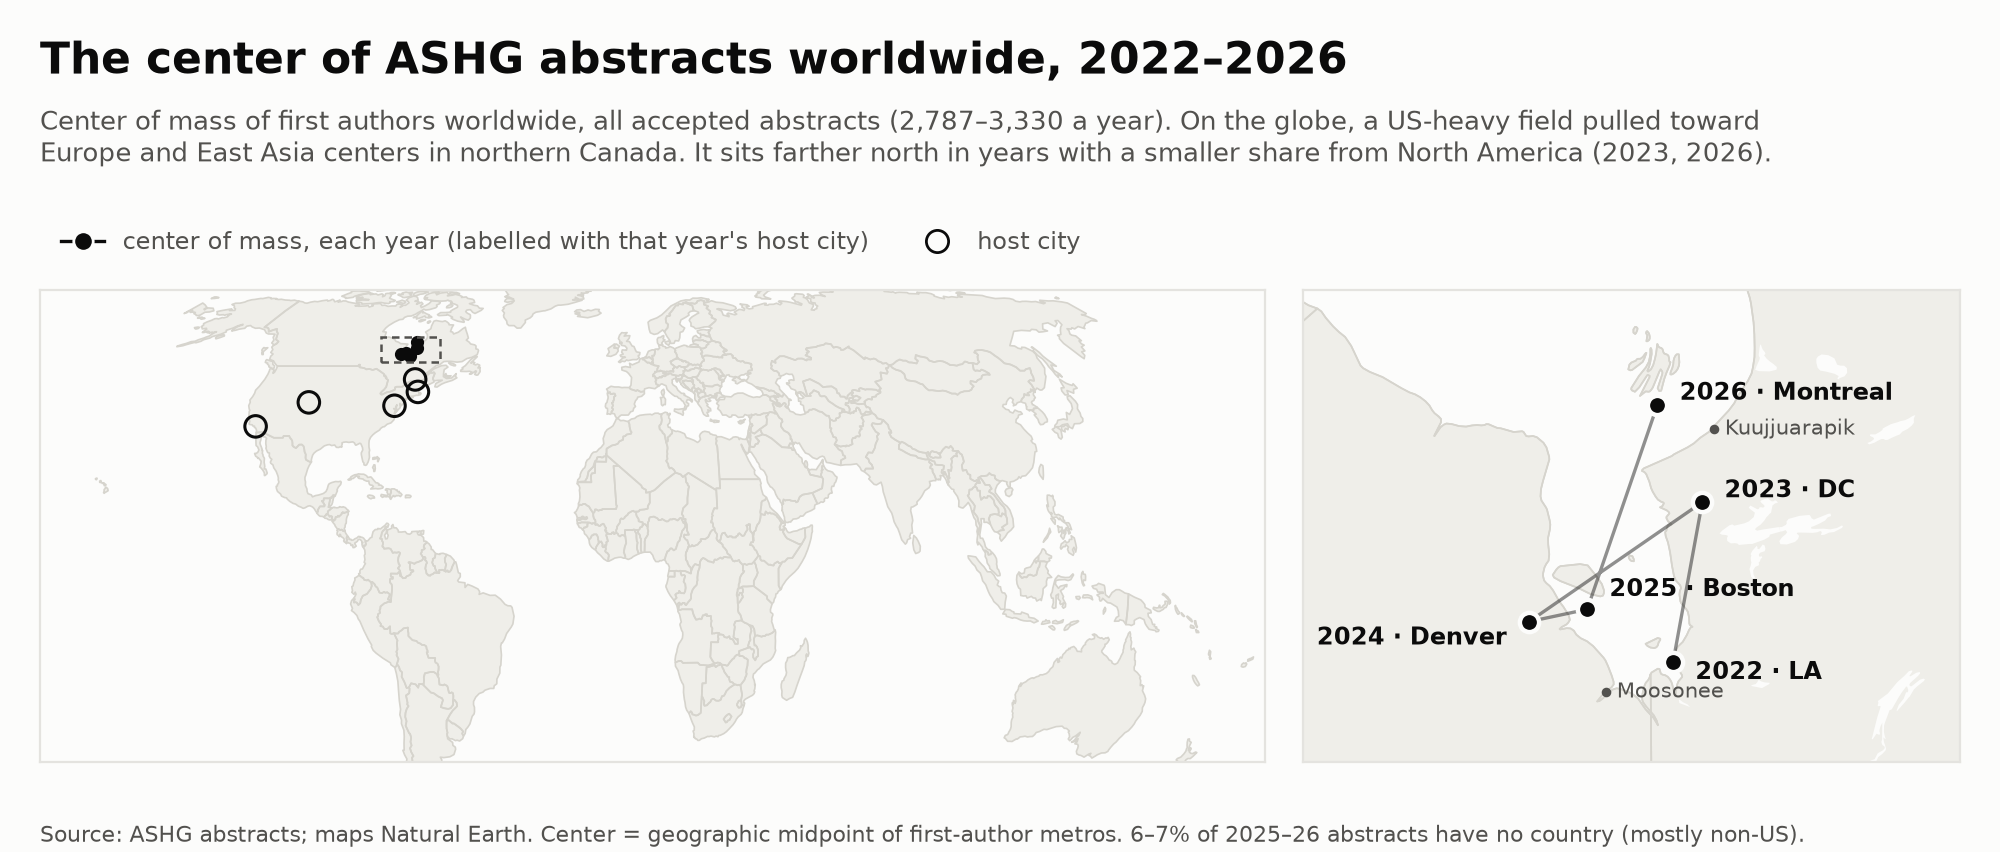
Explore: talks, host city, North America
Table
| Year | Host city | Center | Abstracts | From host city | Moved by host city |
|---|
World regions
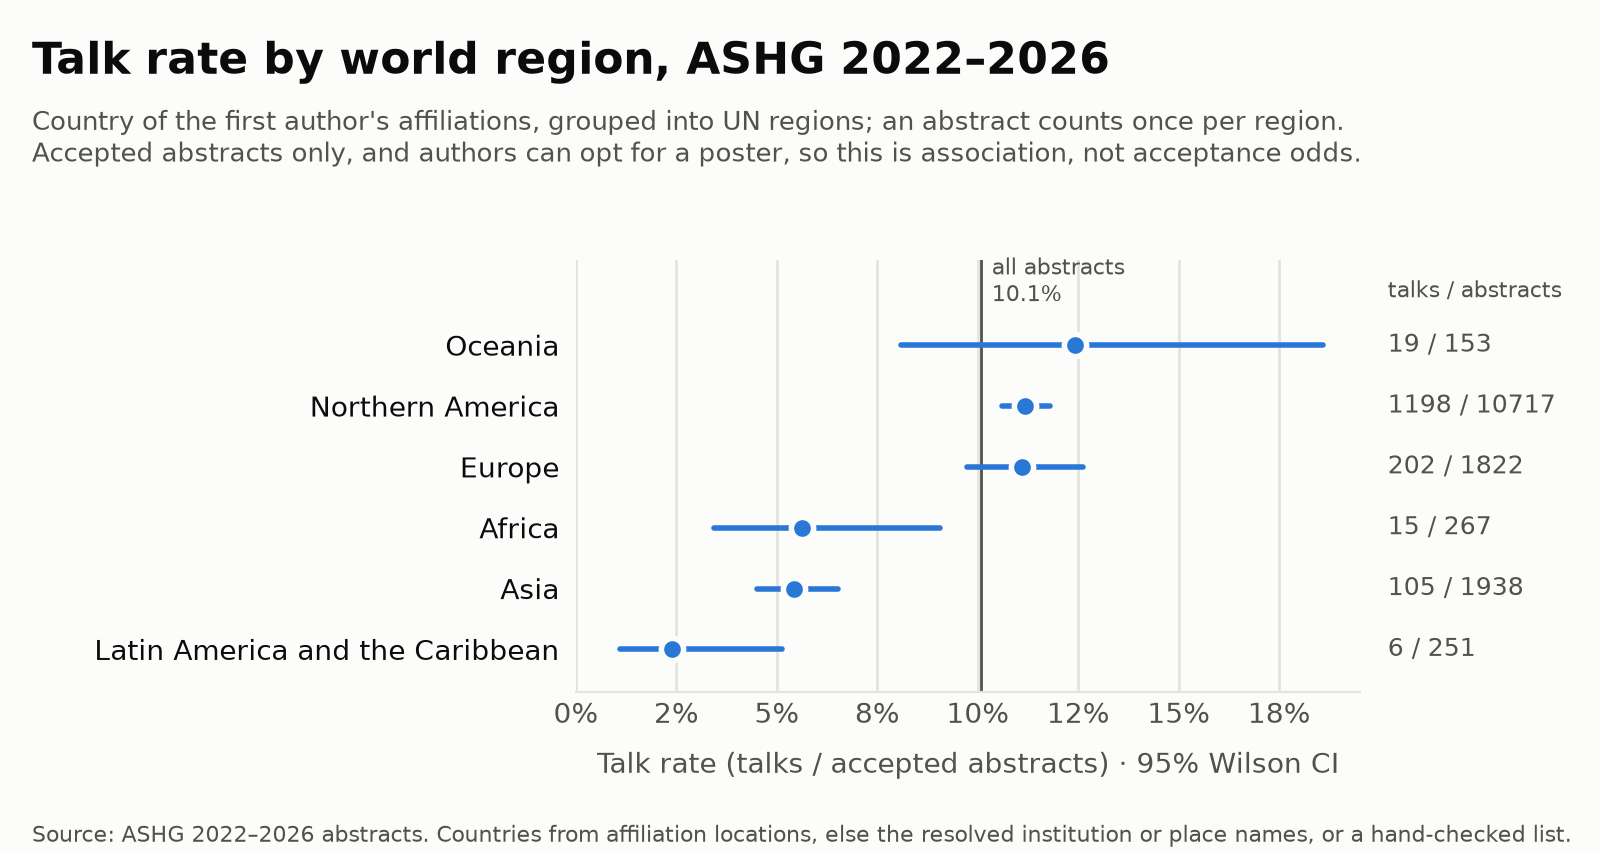
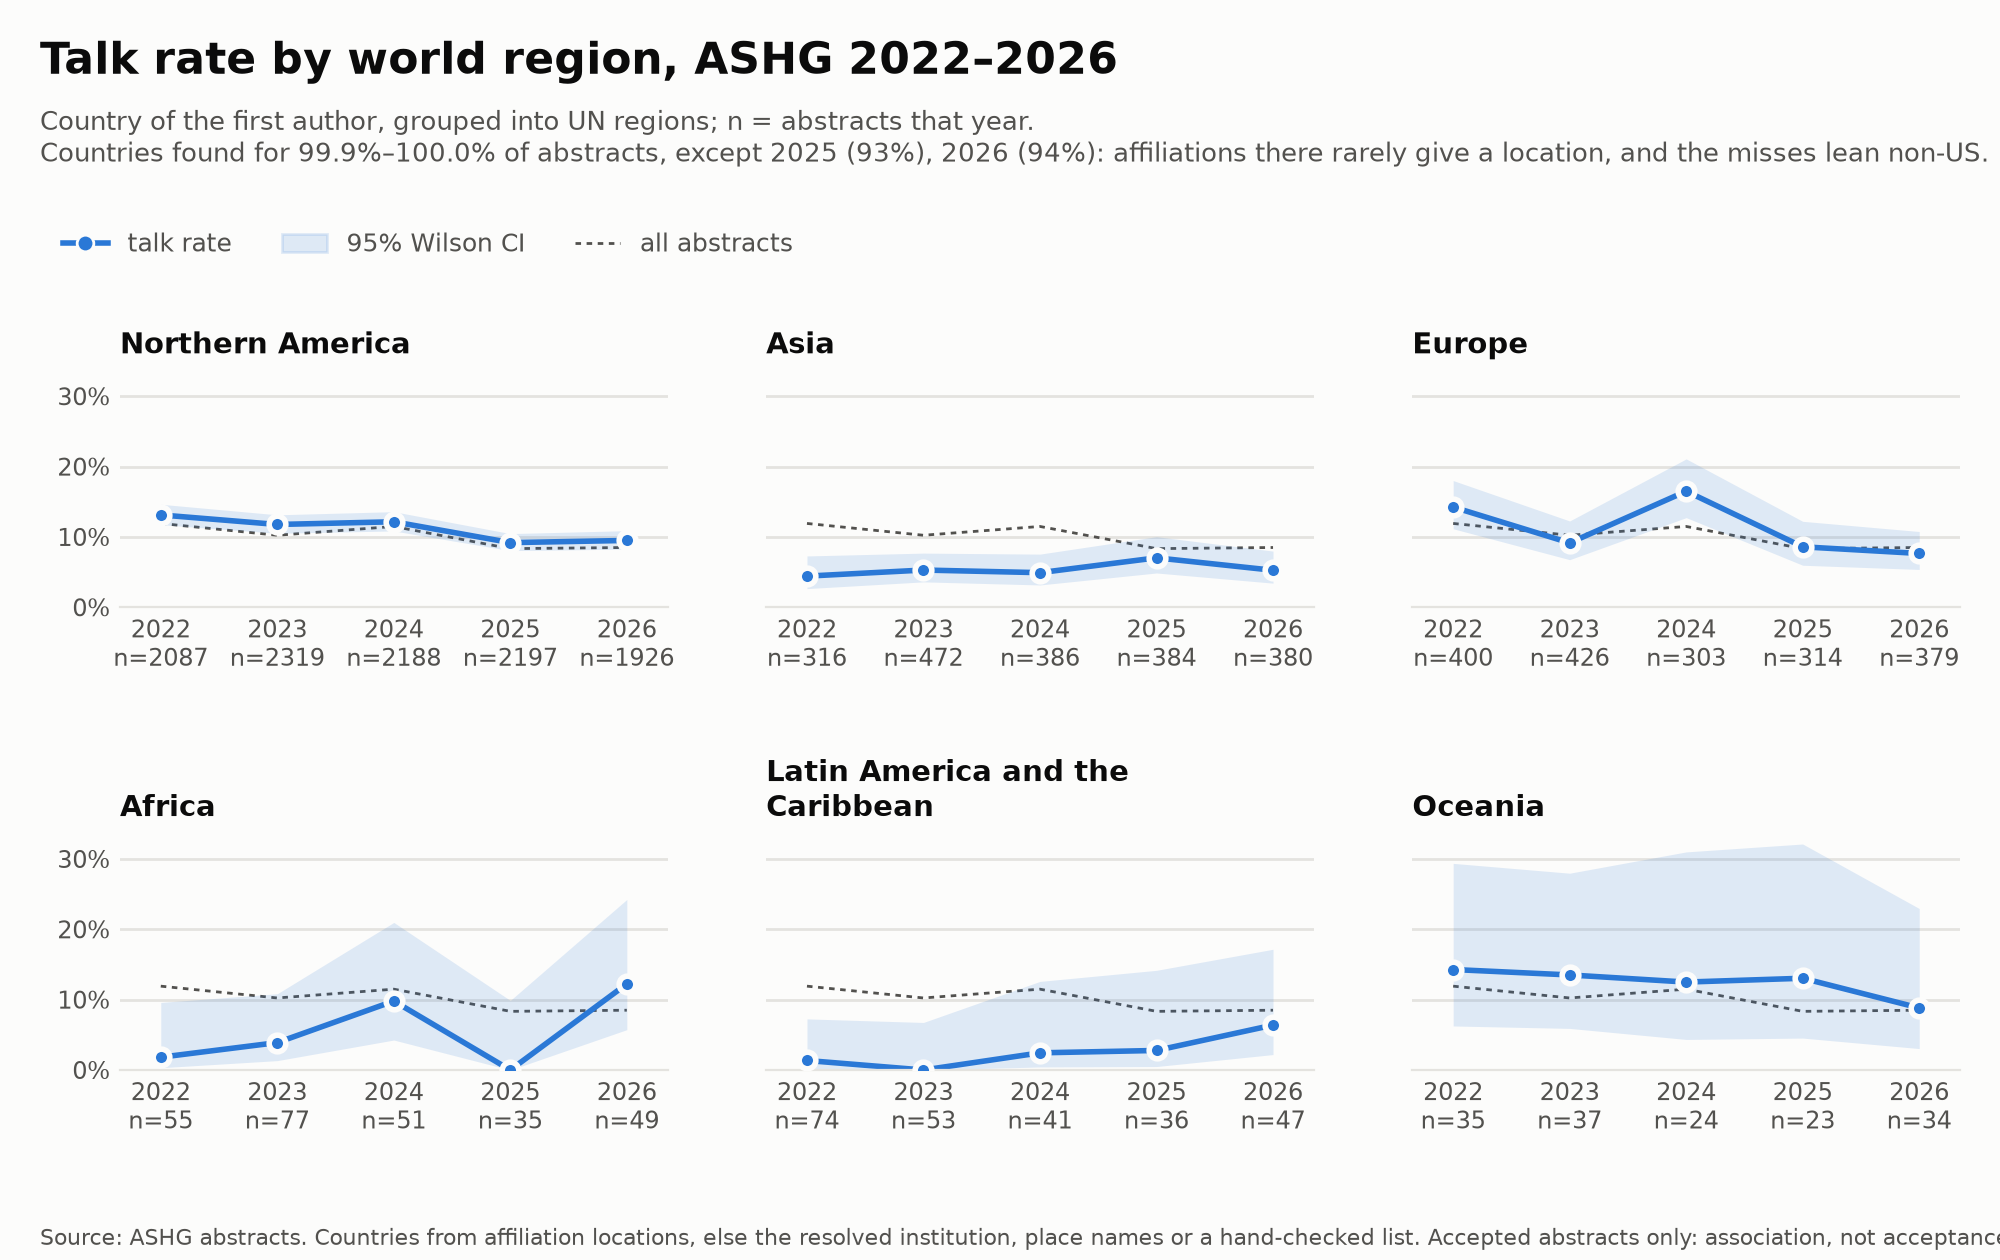
The country of the first author's affiliations, grouped into UN regions (the Americas split into Northern America and Latin America and the Caribbean). An abstract counts once per region.
All years, 2022–2026. In 2025 only 93% of abstracts could be placed, and the misses lean non-US. In 2026 only 94% of abstracts could be placed, and the misses lean non-US.
By first author
| Region | Largest countries | Abstracts | Talks | Talk rate | 95% CI |
|---|---|---|---|---|---|
| Northern America | United States, Canada, Bermuda | 10717 | 1198 | 11.2% | 10.6%–11.8% |
| Asia | Japan, South Korea, China | 1938 | 105 | 5.4% | 4.5%–6.5% |
| Europe | United Kingdom, Germany, Finland | 1822 | 202 | 11.1% | 9.7%–12.6% |
| Africa | Nigeria, Mali, South Africa | 267 | 15 | 5.6% | 3.4%–9.1% |
| Latin America and the Caribbean | Brazil, Mexico, Colombia | 251 | 6 | 2.4% | 1.1%–5.1% |
| Oceania | Australia, New Zealand | 153 | 19 | 12.4% | 8.1%–18.6% |
ASHG 2022: countries read from the affiliation's location for 99.9% of abstracts.
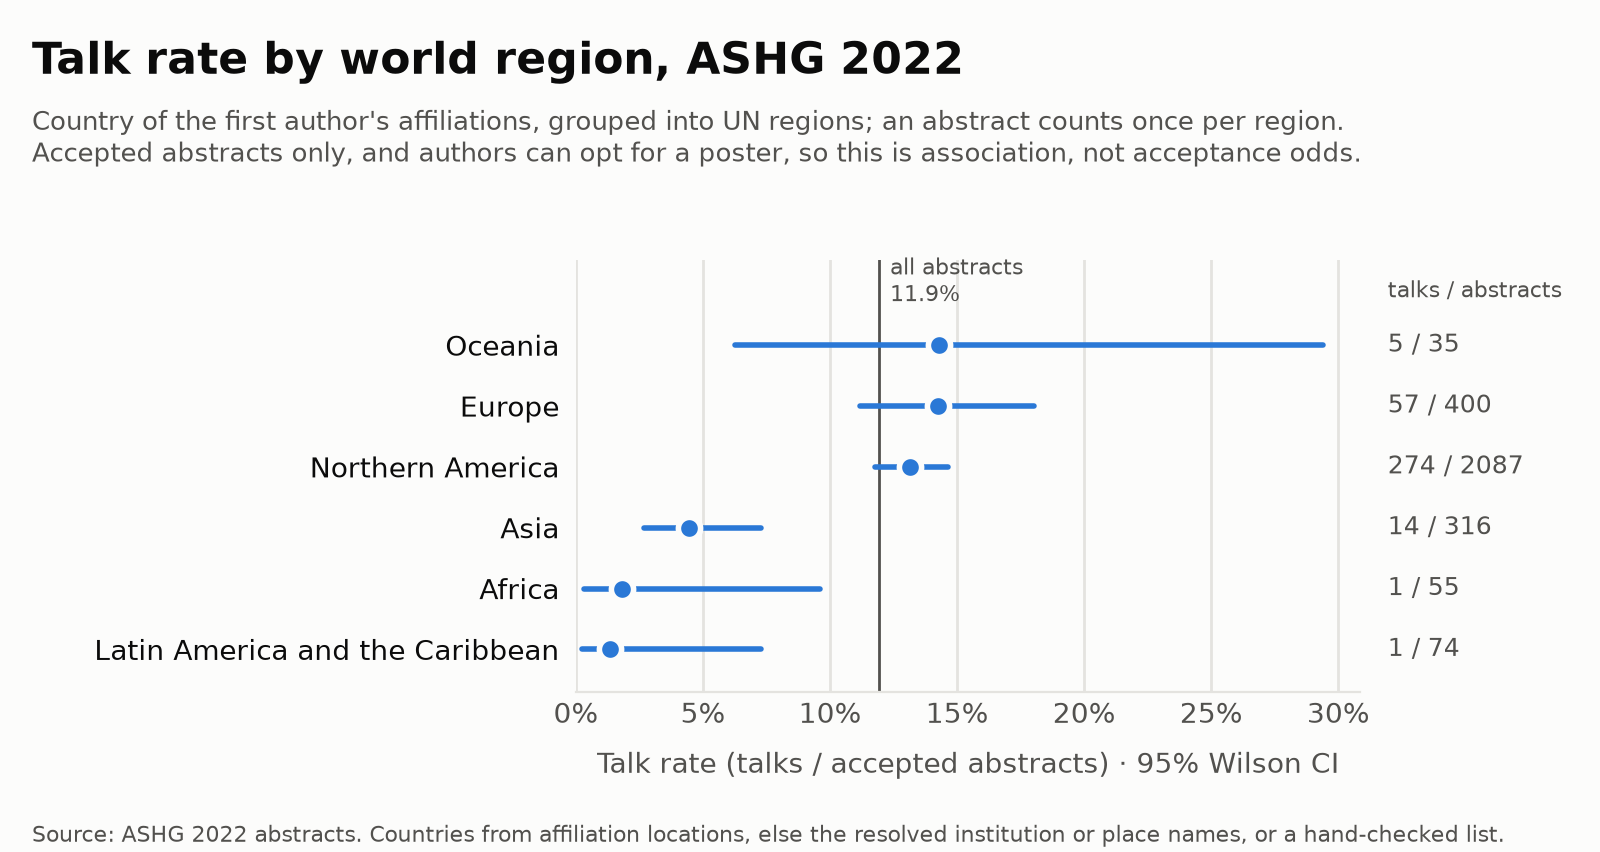
By first author
| Region | Largest countries | Abstracts | Talks | Talk rate | 95% CI |
|---|---|---|---|---|---|
| Northern America | United States, Canada | 2087 | 274 | 13.1% | 11.8%–14.6% |
| Europe | United Kingdom, France, Finland | 400 | 57 | 14.2% | 11.2%–18.0% |
| Asia | South Korea, Japan, India | 316 | 14 | 4.4% | 2.7%–7.3% |
| Latin America and the Caribbean | Brazil, Mexico, Colombia | 74 | 1 | 1.4% | 0.2%–7.3% |
| Africa | Mali, Nigeria, Egypt | 55 | 1 | 1.8% | 0.3%–9.6% |
| Oceania | Australia, New Zealand | 35 | 5 | 14.3% | 6.3%–29.4% |
ASHG 2023: countries read from the affiliation's location for 100.0% of abstracts.
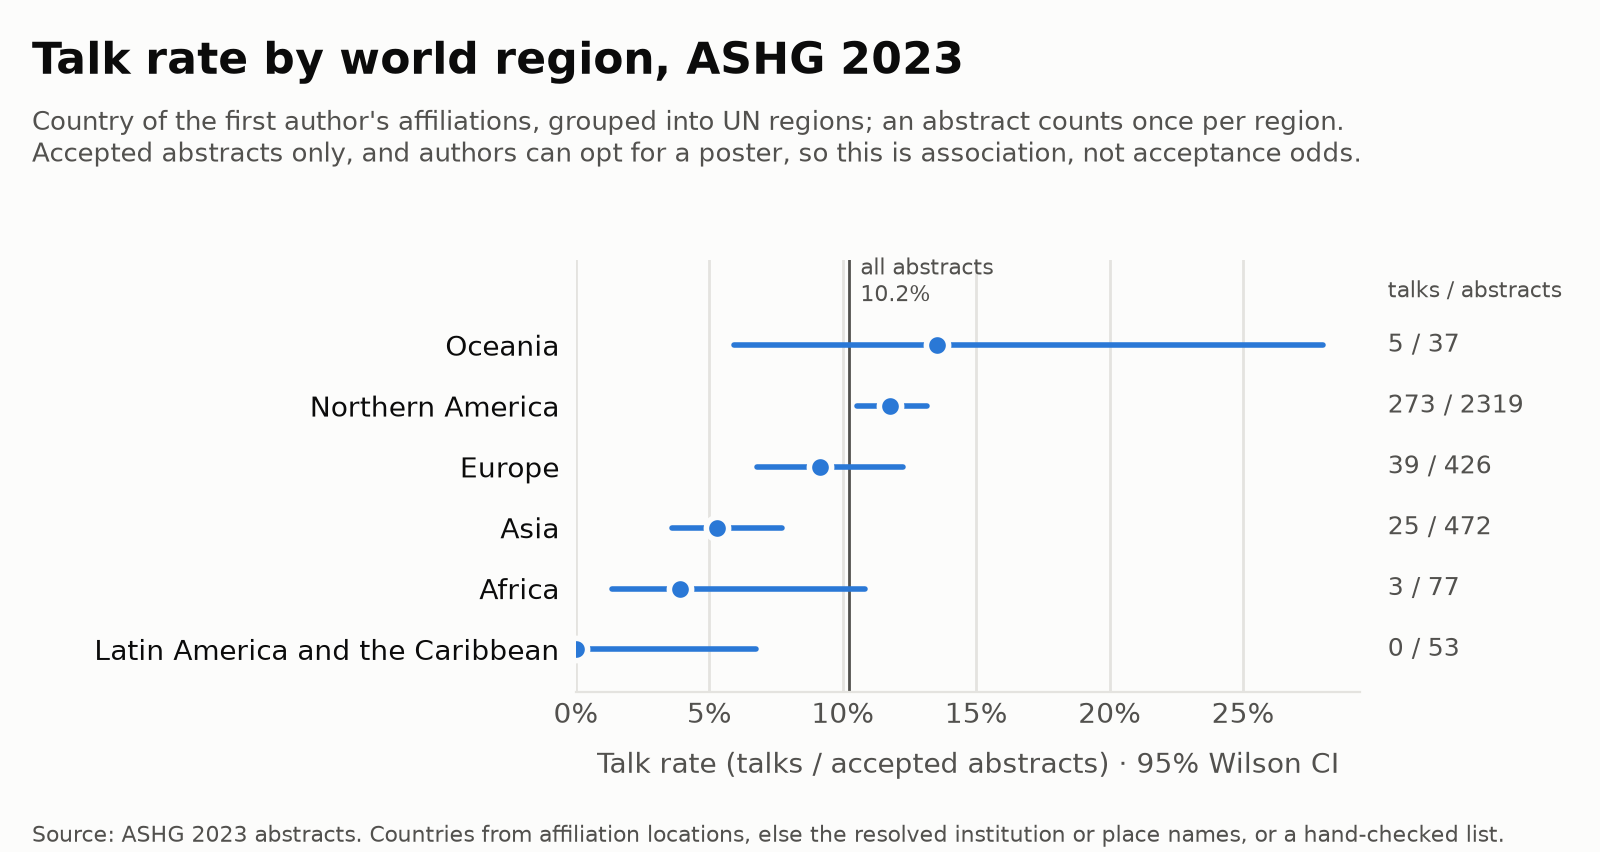
By first author
| Region | Largest countries | Abstracts | Talks | Talk rate | 95% CI |
|---|---|---|---|---|---|
| Northern America | United States, Canada | 2319 | 273 | 11.8% | 10.5%–13.2% |
| Asia | Japan, South Korea, China | 472 | 25 | 5.3% | 3.6%–7.7% |
| Europe | United Kingdom, Germany, Italy | 426 | 39 | 9.2% | 6.8%–12.3% |
| Africa | Nigeria, Egypt, South Africa | 77 | 3 | 3.9% | 1.3%–10.8% |
| Latin America and the Caribbean | Mexico, Brazil, Colombia | 53 | 0 | 0.0% | 0.0%–6.8% |
| Oceania | Australia, New Zealand | 37 | 5 | 13.5% | 5.9%–28.0% |
ASHG 2024: countries read from the affiliation's location for 100.0% of abstracts.
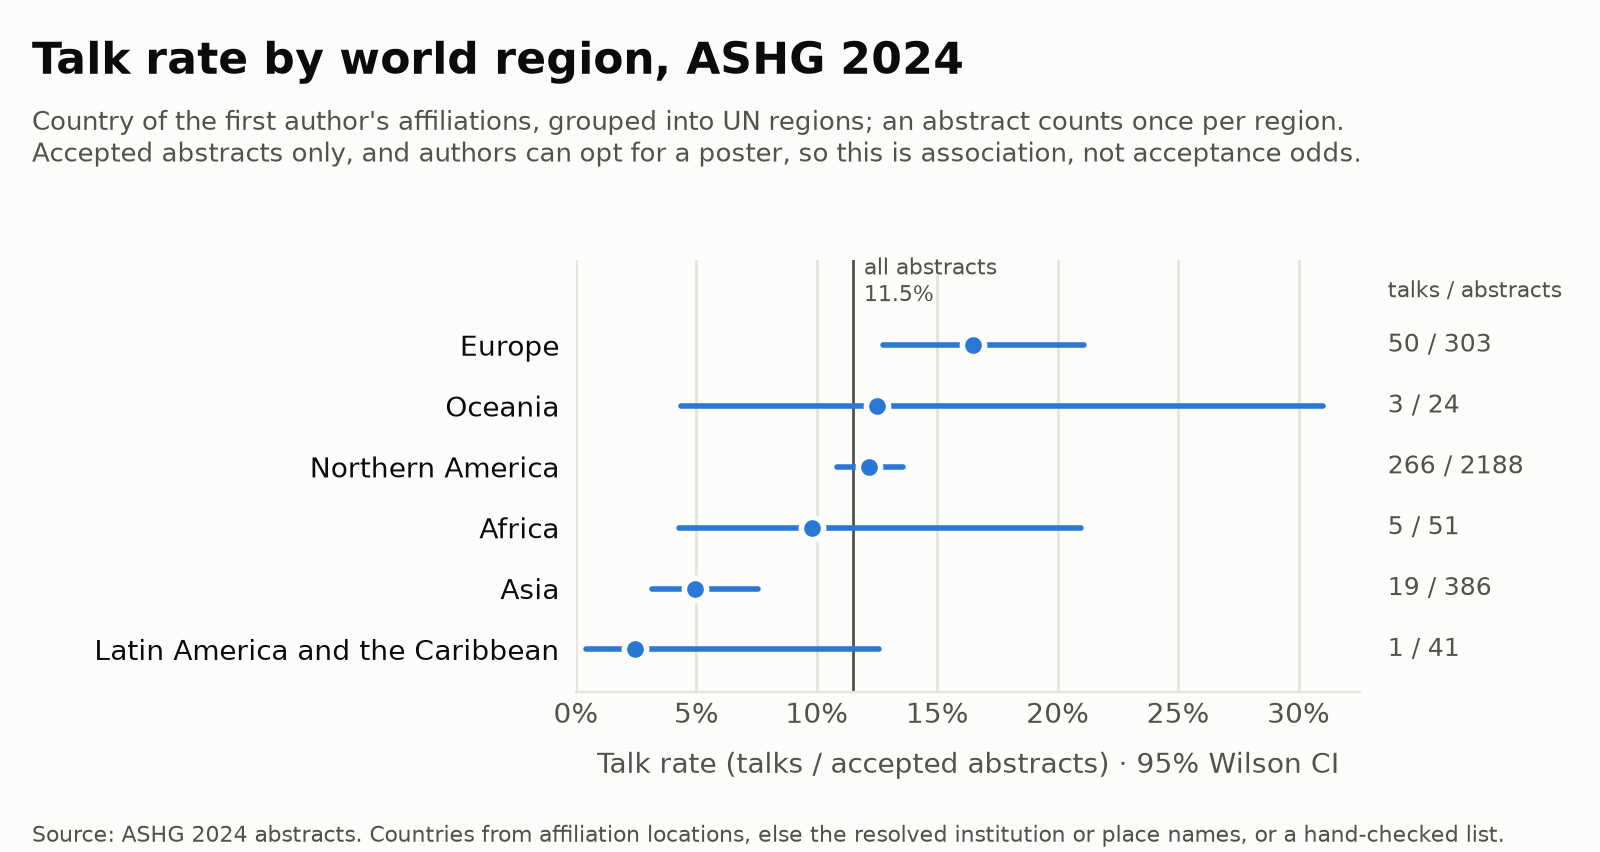
By first author
| Region | Largest countries | Abstracts | Talks | Talk rate | 95% CI |
|---|---|---|---|---|---|
| Northern America | United States, Canada, Bermuda | 2188 | 266 | 12.2% | 10.8%–13.6% |
| Asia | Japan, China, South Korea | 386 | 19 | 4.9% | 3.2%–7.6% |
| Europe | United Kingdom, Germany, Denmark | 303 | 50 | 16.5% | 12.8%–21.1% |
| Africa | Mali, Nigeria, Ghana | 51 | 5 | 9.8% | 4.3%–21.0% |
| Latin America and the Caribbean | Brazil, Mexico, Puerto Rico | 41 | 1 | 2.4% | 0.4%–12.6% |
| Oceania | Australia, New Zealand | 24 | 3 | 12.5% | 4.3%–31.0% |
Only 93% of 2025 abstracts could be placed. That year's affiliations rarely give a city or country, so countries come from the resolved institution, place names, or a hand-checked list of the remaining affiliations. Tested on earlier years, this fallback misses non-US abstracts more often, and the abstracts it misses have a lower talk rate, so read 2025 regions with care.
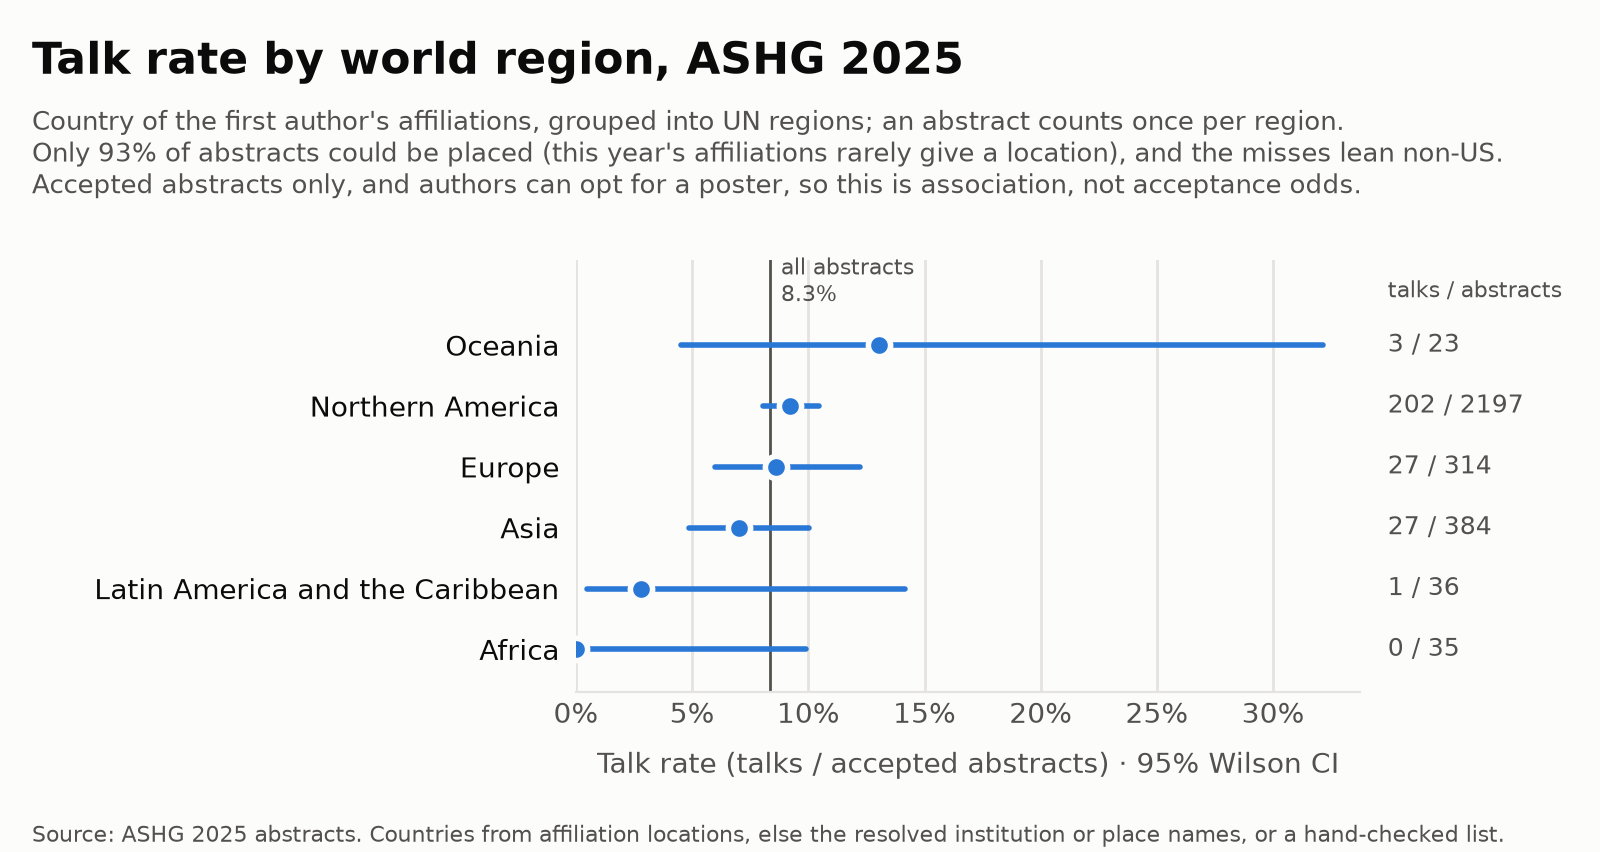
By first author
| Region | Largest countries | Abstracts | Talks | Talk rate | 95% CI |
|---|---|---|---|---|---|
| Northern America | United States, Canada | 2197 | 202 | 9.2% | 8.1%–10.5% |
| Asia | Japan, South Korea, China | 384 | 27 | 7.0% | 4.9%–10.0% |
| Europe | United Kingdom, Germany, Finland | 314 | 27 | 8.6% | 6.0%–12.2% |
| Latin America and the Caribbean | Brazil, Mexico, Colombia | 36 | 1 | 2.8% | 0.5%–14.2% |
| Africa | Nigeria, Kenya, Ghana | 35 | 0 | 0.0% | 0.0%–9.9% |
| Oceania | Australia, New Zealand | 23 | 3 | 13.0% | 4.5%–32.1% |
Only 94% of 2026 abstracts could be placed. That year's affiliations rarely give a city or country, so countries come from the resolved institution, place names, or a hand-checked list of the remaining affiliations. Tested on earlier years, this fallback misses non-US abstracts more often, and the abstracts it misses have a lower talk rate, so read 2026 regions with care.
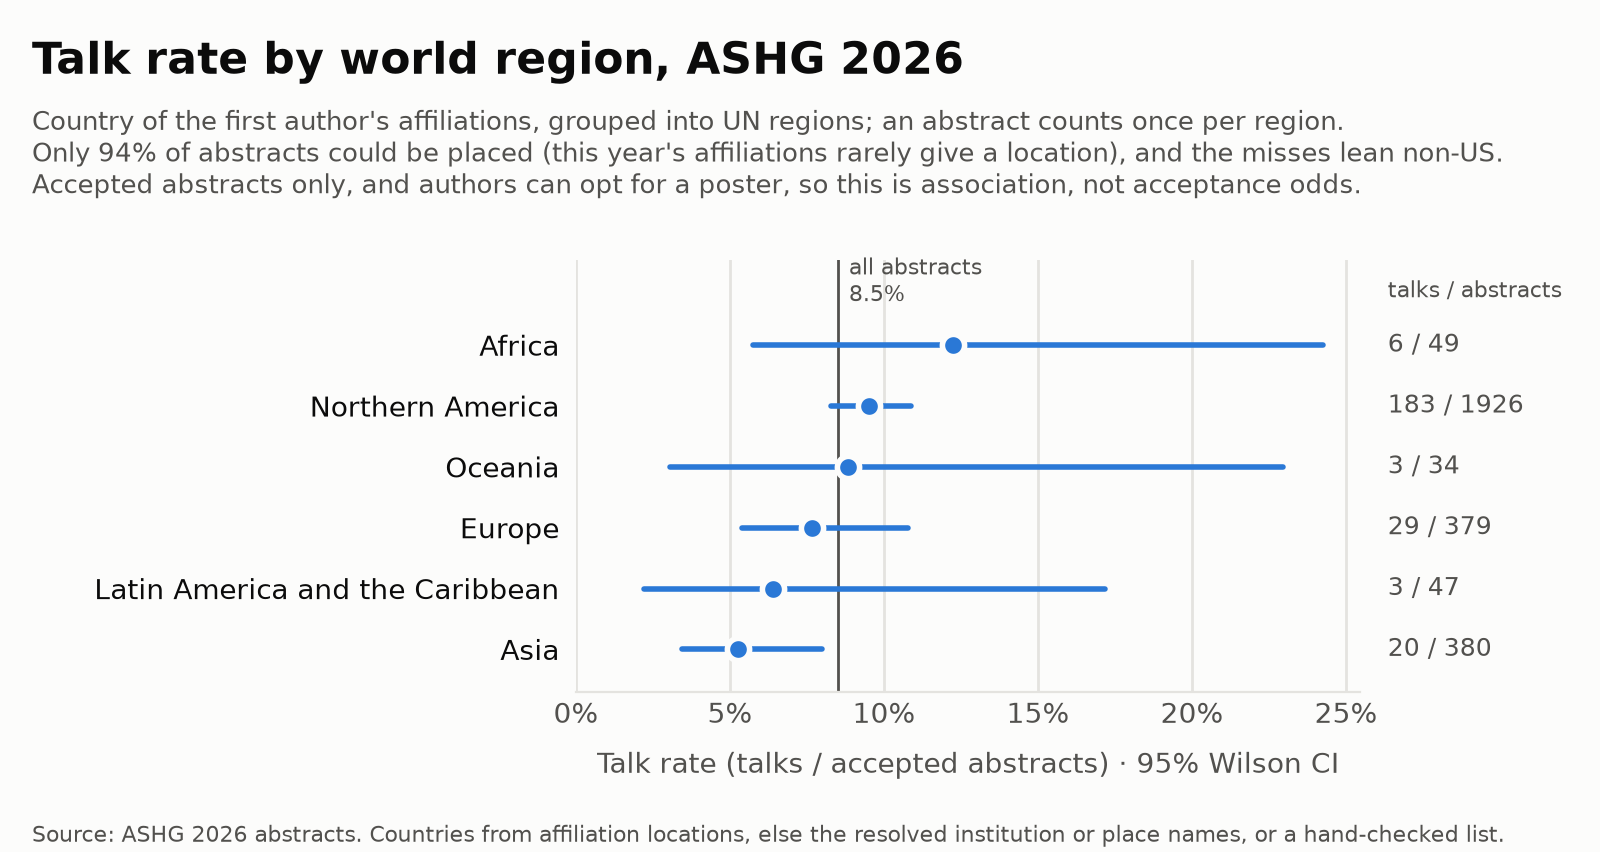
By first author
| Region | Largest countries | Abstracts | Talks | Talk rate | 95% CI |
|---|---|---|---|---|---|
| Northern America | United States, Canada | 1926 | 183 | 9.5% | 8.3%–10.9% |
| Asia | Japan, South Korea, China | 380 | 20 | 5.3% | 3.4%–8.0% |
| Europe | United Kingdom, France, Germany | 379 | 29 | 7.7% | 5.4%–10.8% |
| Africa | Kenya, Nigeria, Ghana | 49 | 6 | 12.2% | 5.7%–24.2% |
| Latin America and the Caribbean | Brazil, Mexico, Chile | 47 | 3 | 6.4% | 2.2%–17.2% |
| Oceania | Australia, New Zealand | 34 | 3 | 8.8% | 3.0%–23.0% |
Countries
The 25 countries with the most abstracts; any without a talk are not listed.
By first author
| Country | Region | Abstracts | Talks | Talk rate | 95% CI |
|---|---|---|---|---|---|
| United States | Northern America | 9809 | 1140 | 11.6% | 11.0%–12.3% |
| Canada | Northern America | 915 | 59 | 6.4% | 5.0%–8.2% |
| United Kingdom | Europe | 681 | 94 | 13.8% | 11.4%–16.6% |
| Japan | Asia | 409 | 27 | 6.6% | 4.6%–9.4% |
| South Korea | Asia | 352 | 19 | 5.4% | 3.5%–8.3% |
| China | Asia | 267 | 24 | 9.0% | 6.1%–13.0% |
| India | Asia | 197 | 1 | 0.5% | 0.1%–2.8% |
| Germany | Europe | 172 | 11 | 6.4% | 3.6%–11.1% |
| Taiwan | Asia | 152 | 7 | 4.6% | 2.2%–9.2% |
| Australia | Oceania | 143 | 18 | 12.6% | 8.1%–19.0% |
| Finland | Europe | 135 | 23 | 17.0% | 11.6%–24.3% |
| France | Europe | 126 | 17 | 13.5% | 8.6%–20.5% |
| Italy | Europe | 122 | 9 | 7.4% | 3.9%–13.4% |
| Switzerland | Europe | 95 | 14 | 14.7% | 9.0%–23.2% |
| Brazil | Latin America and the Caribbean | 92 | 2 | 2.2% | 0.6%–7.6% |
| Hong Kong | Asia | 81 | 3 | 3.7% | 1.3%–10.3% |
| Pakistan | Asia | 79 | 1 | 1.3% | 0.2%–6.8% |
| Singapore | Asia | 76 | 4 | 5.3% | 2.1%–12.8% |
| Netherlands | Europe | 75 | 10 | 13.3% | 7.4%–22.8% |
| Denmark | Europe | 71 | 10 | 14.1% | 7.8%–24.0% |
| Qatar | Asia | 70 | 4 | 5.7% | 2.2%–13.8% |
| Mexico | Latin America and the Caribbean | 70 | 2 | 2.9% | 0.8%–9.8% |
| United Arab Emirates | Asia | 52 | 5 | 9.6% | 4.2%–20.6% |
| Belgium | Europe | 50 | 1 | 2.0% | 0.4%–10.5% |
| Spain | Europe | 48 | 2 | 4.2% | 1.1%–14.0% |
By first author
| Country | Region | Abstracts | Talks | Talk rate | 95% CI |
|---|---|---|---|---|---|
| United States | Northern America | 1925 | 258 | 13.4% | 11.9%–15.0% |
| Canada | Northern America | 163 | 16 | 9.8% | 6.1%–15.3% |
| United Kingdom | Europe | 133 | 23 | 17.3% | 11.8%–24.6% |
| South Korea | Asia | 60 | 5 | 8.3% | 3.6%–18.1% |
| Japan | Asia | 55 | 3 | 5.5% | 1.9%–14.8% |
| France | Europe | 37 | 6 | 16.2% | 7.7%–31.1% |
| Finland | Europe | 34 | 8 | 23.5% | 12.4%–40.0% |
| Italy | Europe | 34 | 3 | 8.8% | 3.0%–23.0% |
| Germany | Europe | 33 | 4 | 12.1% | 4.8%–27.3% |
| Australia | Oceania | 32 | 5 | 15.6% | 6.9%–31.8% |
| Switzerland | Europe | 26 | 3 | 11.5% | 4.0%–29.0% |
| Qatar | Asia | 23 | 1 | 4.3% | 0.8%–21.0% |
| Netherlands | Europe | 21 | 3 | 14.3% | 5.0%–34.6% |
| China | Asia | 15 | 3 | 20.0% | 7.0%–45.2% |
| Colombia | Latin America and the Caribbean | 15 | 1 | 6.7% | 1.2%–29.8% |
| Sweden | Europe | 13 | 2 | 15.4% | 4.3%–42.2% |
By first author
| Country | Region | Abstracts | Talks | Talk rate | 95% CI |
|---|---|---|---|---|---|
| United States | Northern America | 2173 | 264 | 12.2% | 10.8%–13.6% |
| Canada | Northern America | 147 | 9 | 6.1% | 3.3%–11.2% |
| United Kingdom | Europe | 137 | 21 | 15.3% | 10.2%–22.3% |
| Japan | Asia | 106 | 9 | 8.5% | 4.5%–15.3% |
| South Korea | Asia | 82 | 5 | 6.1% | 2.6%–13.5% |
| China | Asia | 54 | 5 | 9.3% | 4.0%–19.9% |
| Germany | Europe | 38 | 1 | 2.6% | 0.5%–13.5% |
| Australia | Oceania | 35 | 4 | 11.4% | 4.5%–25.9% |
| Italy | Europe | 31 | 3 | 9.7% | 3.3%–24.9% |
| Taiwan | Asia | 31 | 1 | 3.2% | 0.6%–16.2% |
| Switzerland | Europe | 29 | 5 | 17.2% | 7.6%–34.5% |
| Finland | Europe | 26 | 4 | 15.4% | 6.2%–33.5% |
| France | Europe | 25 | 1 | 4.0% | 0.7%–19.5% |
| Hong Kong | Asia | 22 | 1 | 4.5% | 0.8%–21.8% |
| Netherlands | Europe | 21 | 1 | 4.8% | 0.8%–22.7% |
| Denmark | Europe | 20 | 1 | 5.0% | 0.9%–23.6% |
| Israel | Asia | 14 | 1 | 7.1% | 1.3%–31.5% |
By first author
| Country | Region | Abstracts | Talks | Talk rate | 95% CI |
|---|---|---|---|---|---|
| United States | Northern America | 2072 | 256 | 12.4% | 11.0%–13.8% |
| United Kingdom | Europe | 124 | 22 | 17.7% | 12.0%–25.4% |
| Canada | Northern America | 116 | 10 | 8.6% | 4.8%–15.1% |
| Japan | Asia | 79 | 5 | 6.3% | 2.7%–14.0% |
| China | Asia | 69 | 4 | 5.8% | 2.3%–14.0% |
| South Korea | Asia | 64 | 4 | 6.2% | 2.5%–15.0% |
| Taiwan | Asia | 33 | 2 | 6.1% | 1.7%–19.6% |
| Germany | Europe | 32 | 4 | 12.5% | 5.0%–28.1% |
| Australia | Oceania | 23 | 3 | 13.0% | 4.5%–32.1% |
| Denmark | Europe | 21 | 3 | 14.3% | 5.0%–34.6% |
| Finland | Europe | 20 | 4 | 20.0% | 8.1%–41.6% |
| Pakistan | Asia | 15 | 1 | 6.7% | 1.2%–29.8% |
| Singapore | Asia | 15 | 1 | 6.7% | 1.2%–29.8% |
| France | Europe | 14 | 3 | 21.4% | 7.6%–47.6% |
| Brazil | Latin America and the Caribbean | 13 | 1 | 7.7% | 1.4%–33.3% |
| United Arab Emirates | Asia | 13 | 1 | 7.7% | 1.4%–33.3% |
| Netherlands | Europe | 12 | 5 | 41.7% | 19.3%–68.0% |
| Belgium | Europe | 11 | 1 | 9.1% | 1.6%–37.7% |
| Switzerland | Europe | 10 | 2 | 20.0% | 5.7%–51.0% |
| Qatar | Asia | 10 | 1 | 10.0% | 1.8%–40.4% |
By first author
| Country | Region | Abstracts | Talks | Talk rate | 95% CI |
|---|---|---|---|---|---|
| United States | Northern America | 2108 | 195 | 9.2% | 8.1%–10.6% |
| United Kingdom | Europe | 128 | 16 | 12.5% | 7.8%–19.3% |
| Canada | Northern America | 90 | 7 | 7.8% | 3.8%–15.2% |
| Japan | Asia | 81 | 7 | 8.6% | 4.2%–16.8% |
| South Korea | Asia | 74 | 1 | 1.4% | 0.2%–7.3% |
| China | Asia | 65 | 6 | 9.2% | 4.3%–18.7% |
| Taiwan | Asia | 38 | 3 | 7.9% | 2.7%–20.8% |
| India | Asia | 32 | 1 | 3.1% | 0.6%–15.7% |
| Finland | Europe | 30 | 4 | 13.3% | 5.3%–29.7% |
| Hong Kong | Asia | 23 | 2 | 8.7% | 2.4%–26.8% |
| Australia | Oceania | 21 | 3 | 14.3% | 5.0%–34.6% |
| Italy | Europe | 20 | 1 | 5.0% | 0.9%–23.6% |
| Switzerland | Europe | 18 | 2 | 11.1% | 3.1%–32.8% |
| France | Europe | 14 | 3 | 21.4% | 7.6%–47.6% |
| Singapore | Asia | 13 | 1 | 7.7% | 1.4%–33.3% |
| United Arab Emirates | Asia | 12 | 2 | 16.7% | 4.7%–44.8% |
| Denmark | Europe | 10 | 2 | 20.0% | 5.7%–51.0% |
| Spain | Europe | 7 | 1 | 14.3% | 2.6%–51.3% |
By first author
| Country | Region | Abstracts | Talks | Talk rate | 95% CI |
|---|---|---|---|---|---|
| United States | Northern America | 1531 | 167 | 10.9% | 9.4%–12.6% |
| Canada | Northern America | 399 | 17 | 4.3% | 2.7%–6.7% |
| United Kingdom | Europe | 159 | 12 | 7.5% | 4.4%–12.7% |
| Japan | Asia | 88 | 3 | 3.4% | 1.2%–9.6% |
| South Korea | Asia | 72 | 4 | 5.6% | 2.2%–13.4% |
| China | Asia | 64 | 6 | 9.4% | 4.4%–19.0% |
| Taiwan | Asia | 39 | 1 | 2.6% | 0.5%–13.2% |
| France | Europe | 36 | 4 | 11.1% | 4.4%–25.3% |
| Germany | Europe | 36 | 2 | 5.6% | 1.5%–18.1% |
| Australia | Oceania | 32 | 3 | 9.4% | 3.2%–24.2% |
| Finland | Europe | 25 | 3 | 12.0% | 4.2%–30.0% |
| Brazil | Latin America and the Caribbean | 24 | 1 | 4.2% | 0.7%–20.2% |
| Singapore | Asia | 23 | 2 | 8.7% | 2.4%–26.8% |
| Italy | Europe | 21 | 2 | 9.5% | 2.7%–28.9% |
| Mexico | Latin America and the Caribbean | 16 | 2 | 12.5% | 3.5%–36.0% |
| Denmark | Europe | 13 | 1 | 7.7% | 1.4%–33.3% |
| Qatar | Asia | 12 | 2 | 16.7% | 4.7%–44.8% |
| Switzerland | Europe | 12 | 2 | 16.7% | 4.7%–44.8% |
| Kenya | Africa | 11 | 1 | 9.1% | 1.6%–37.7% |
| Estonia | Europe | 10 | 1 | 10.0% | 1.8%–40.4% |
| Netherlands | Europe | 10 | 1 | 10.0% | 1.8%–40.4% |
| Nigeria | Africa | 10 | 1 | 10.0% | 1.8%–40.4% |
Metro areas
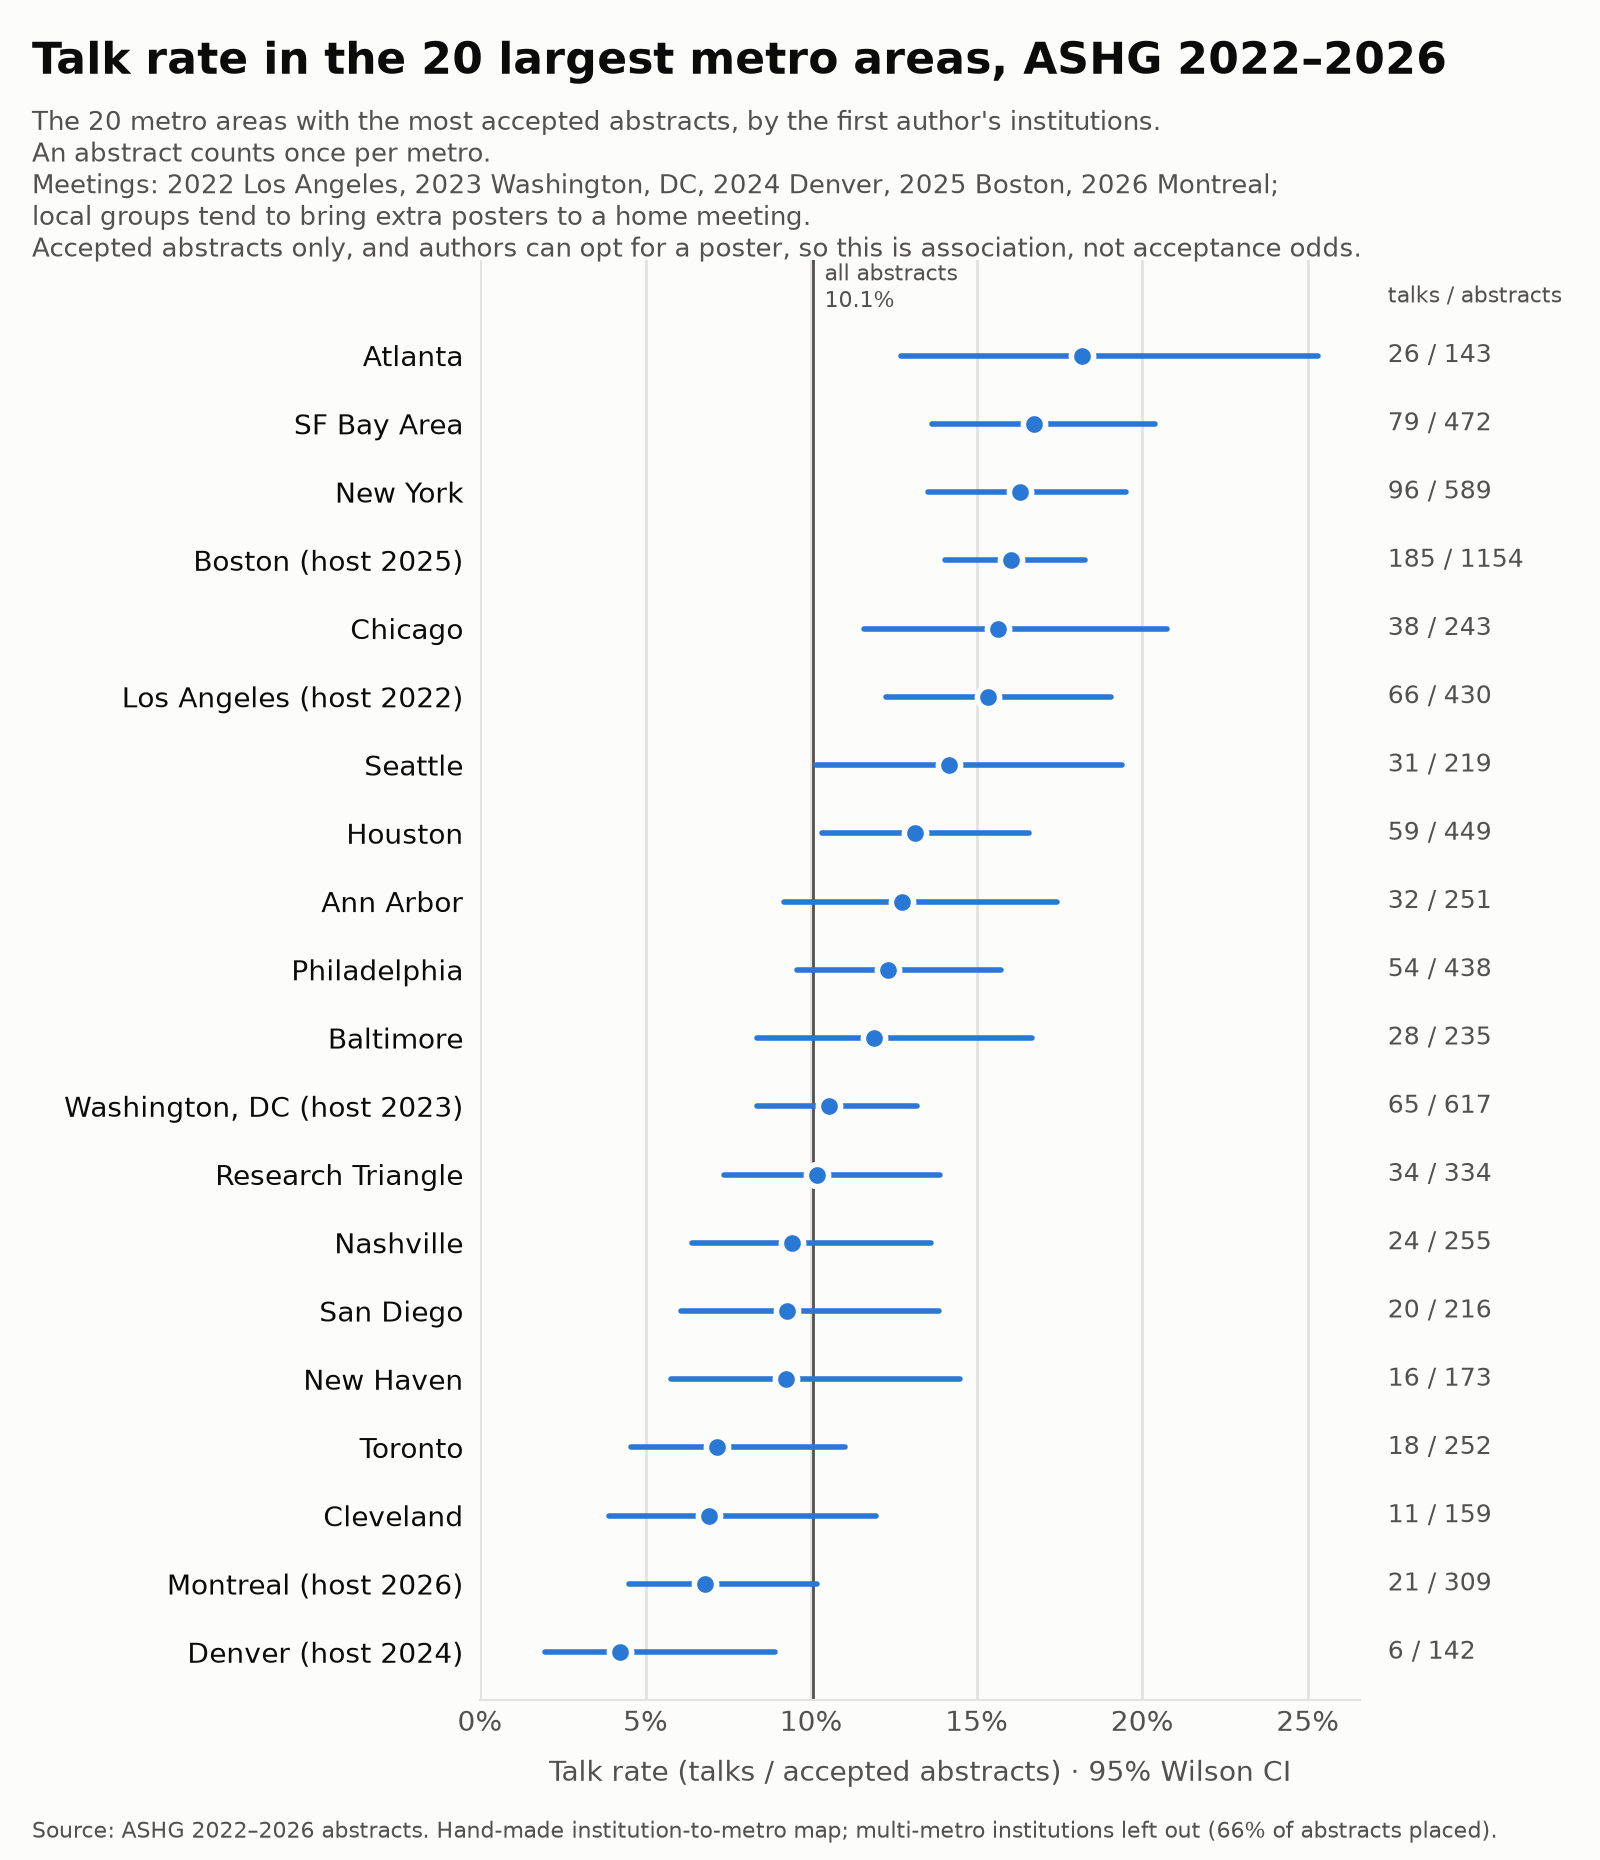
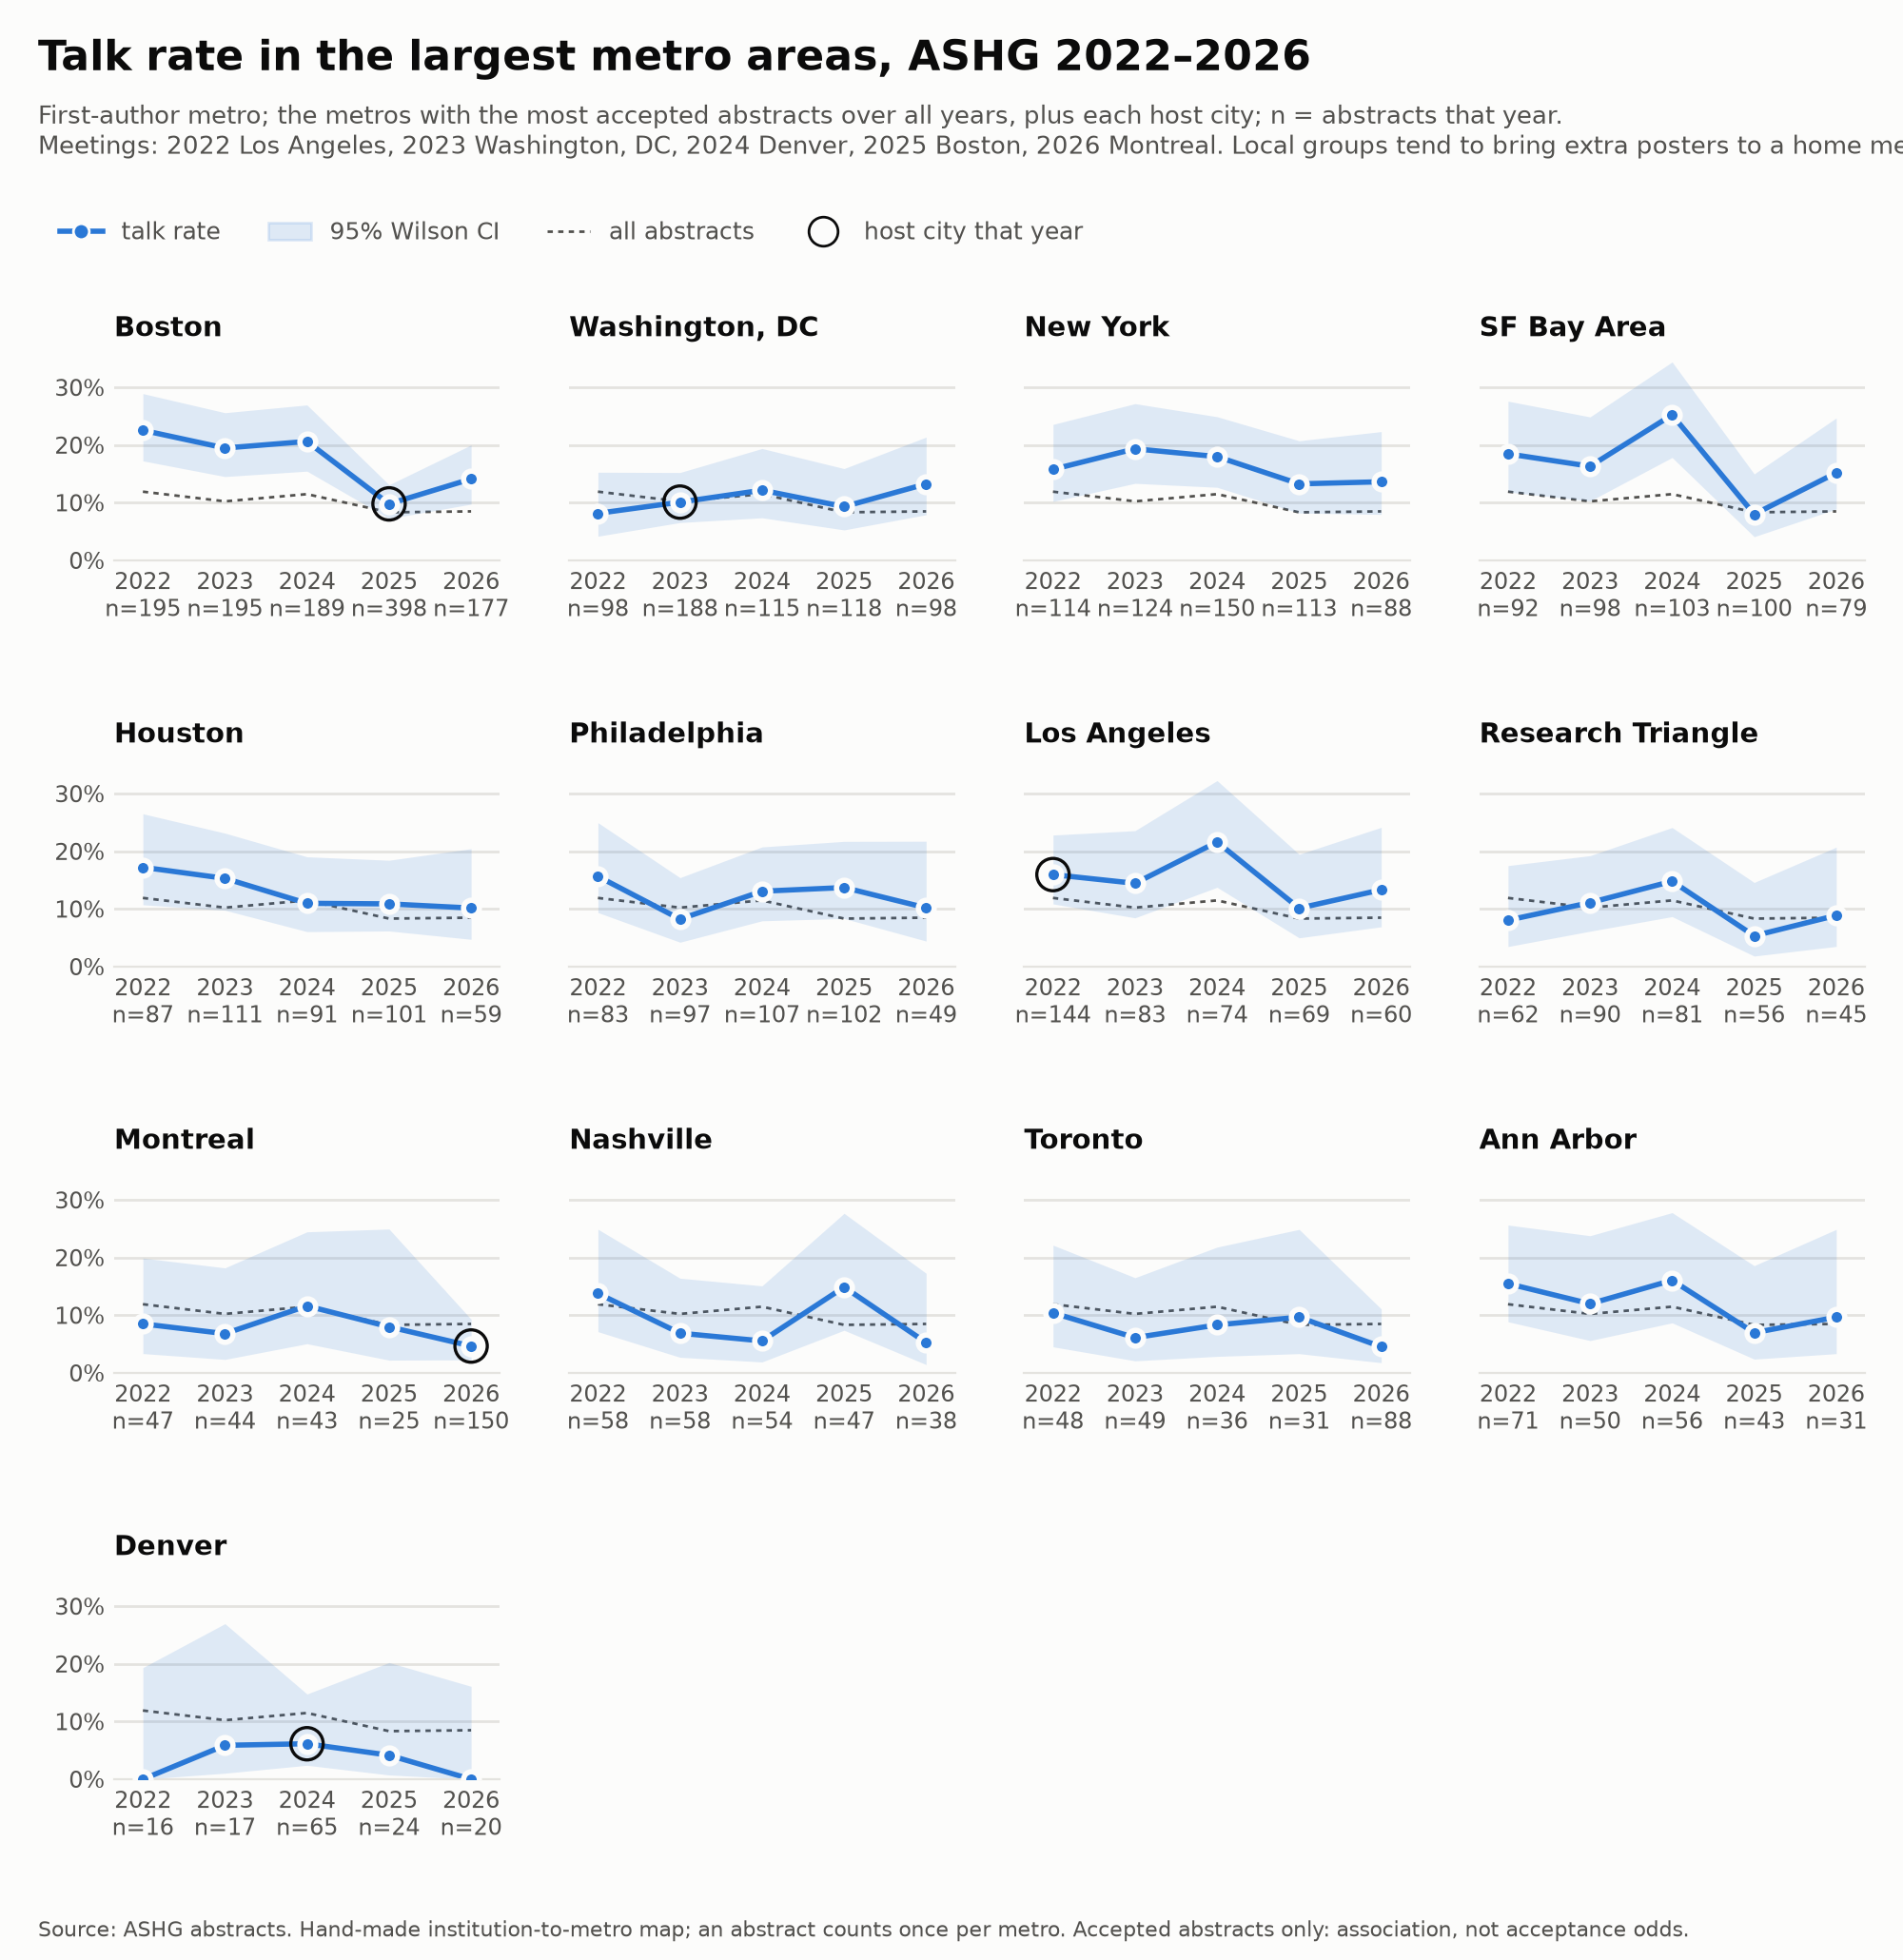
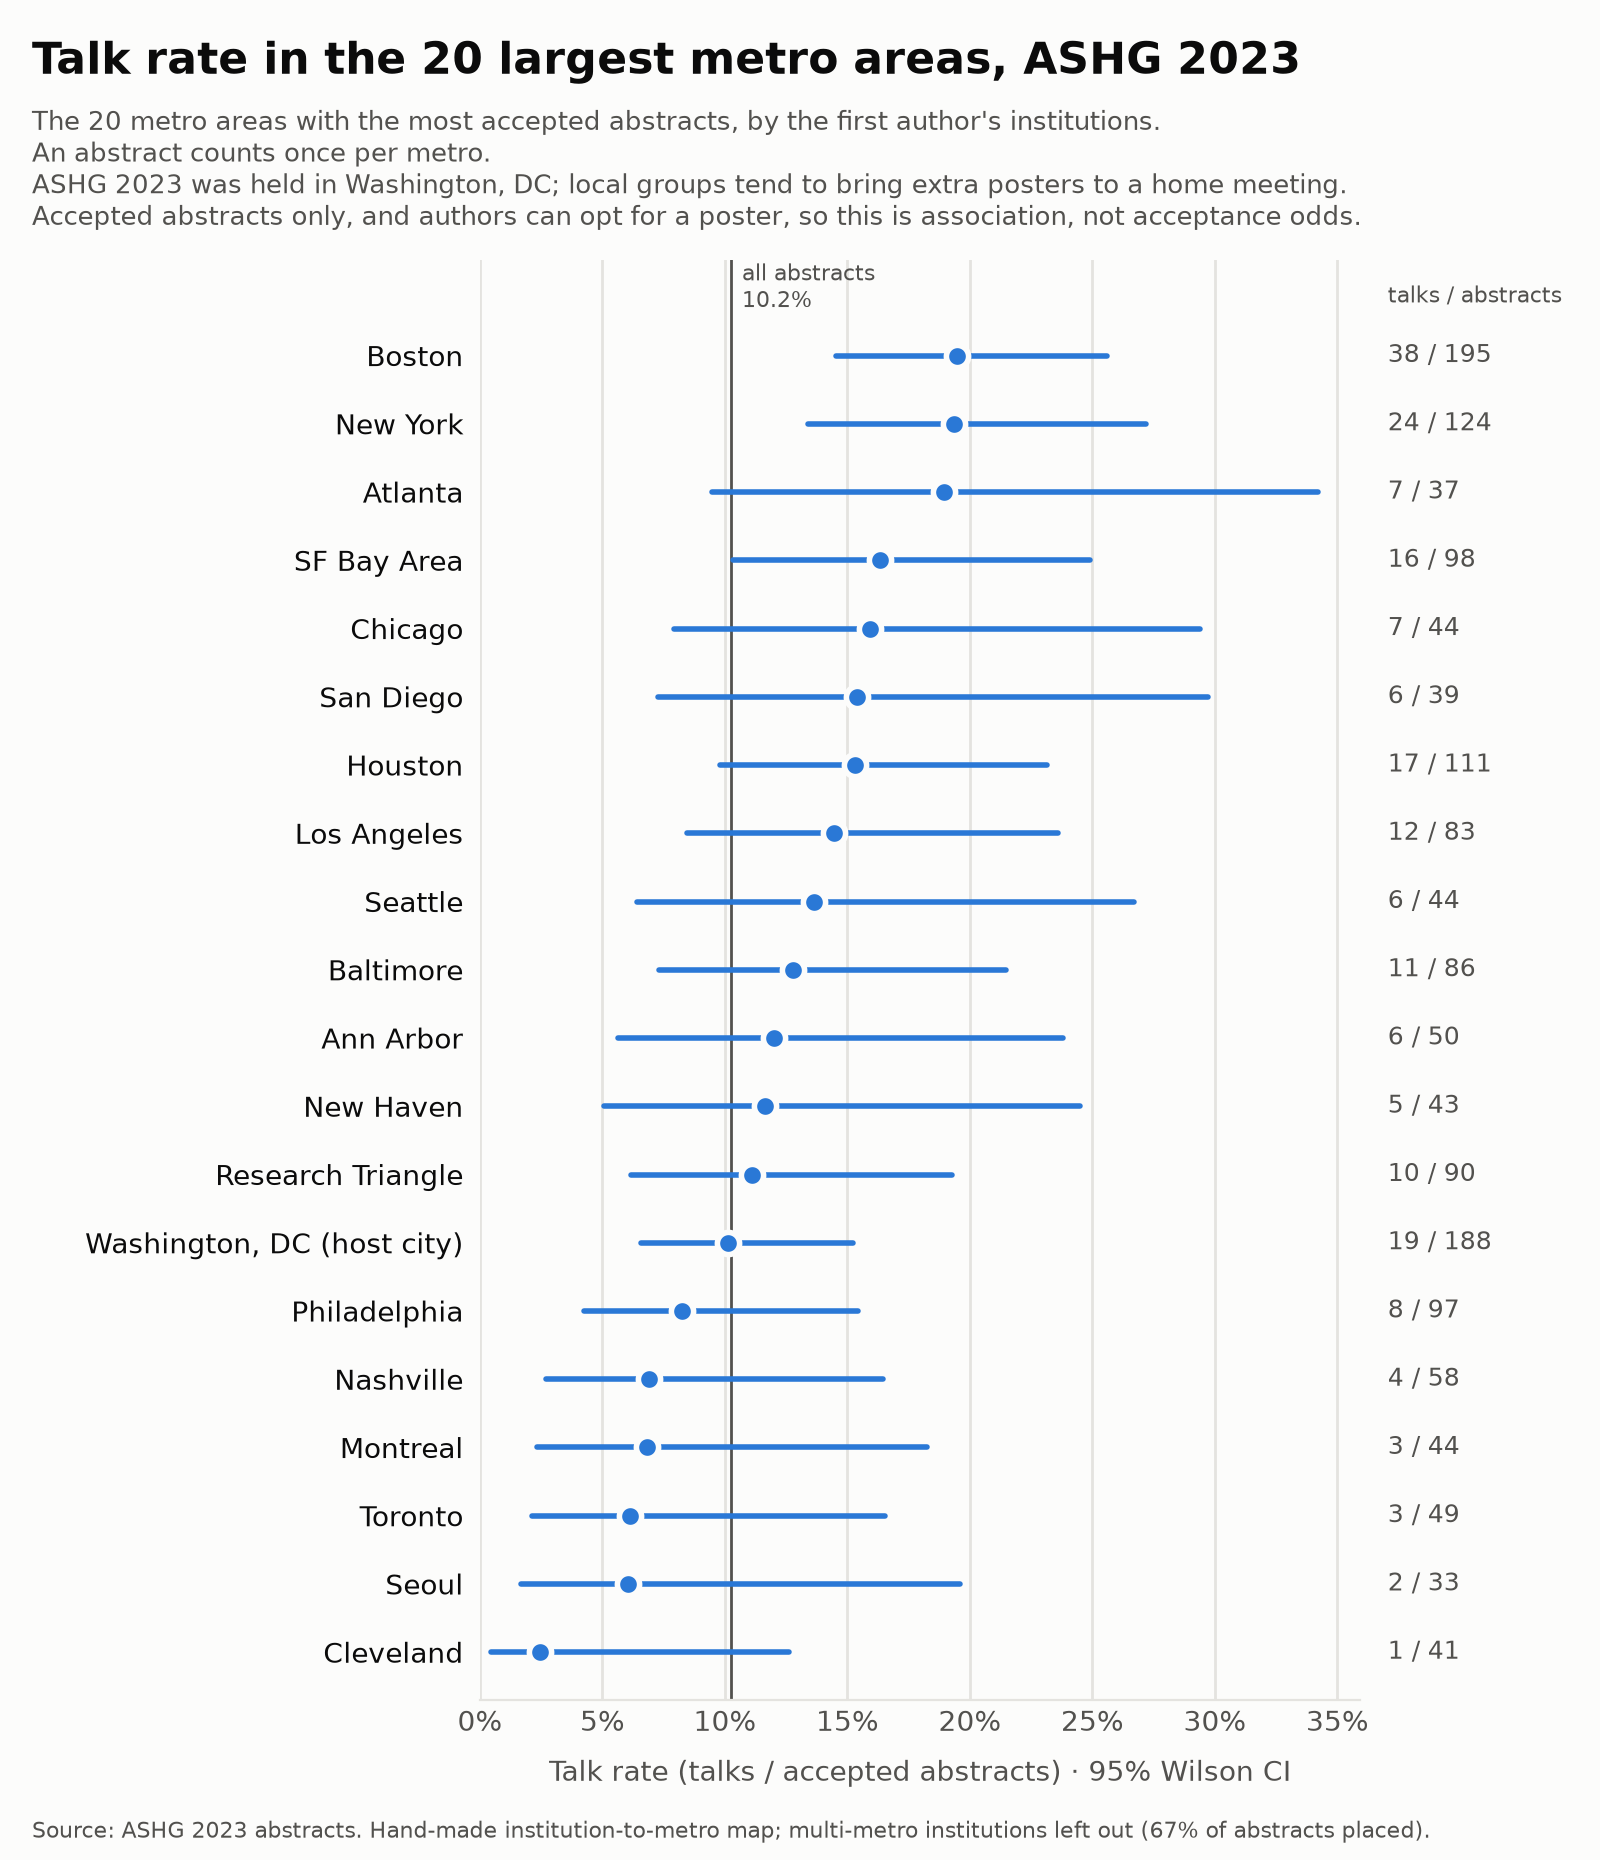
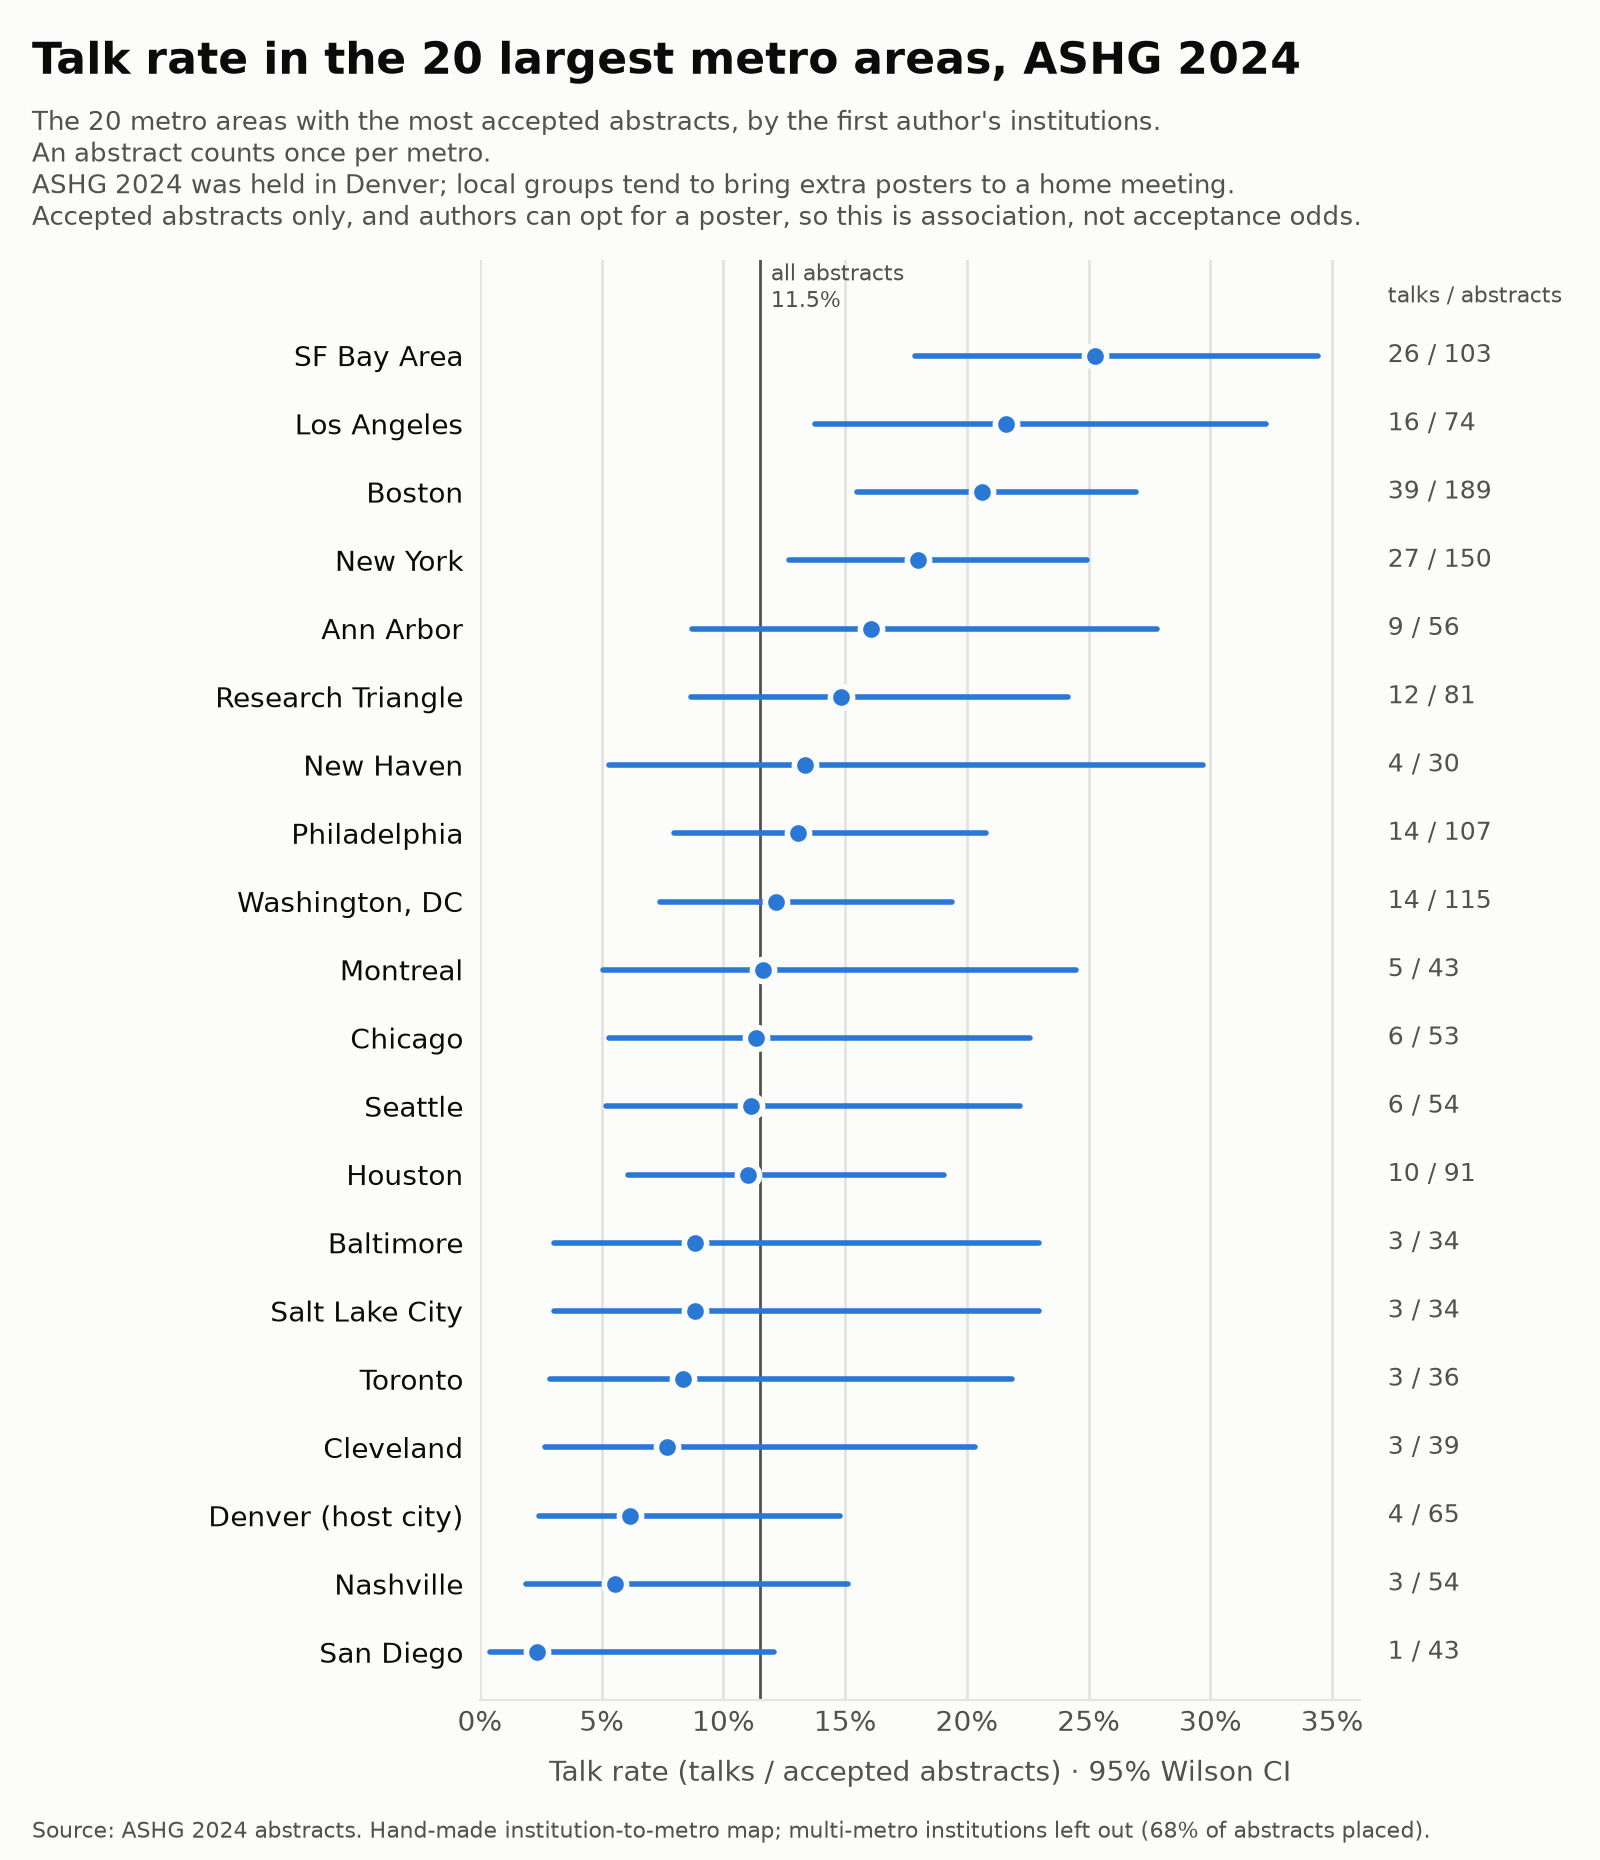
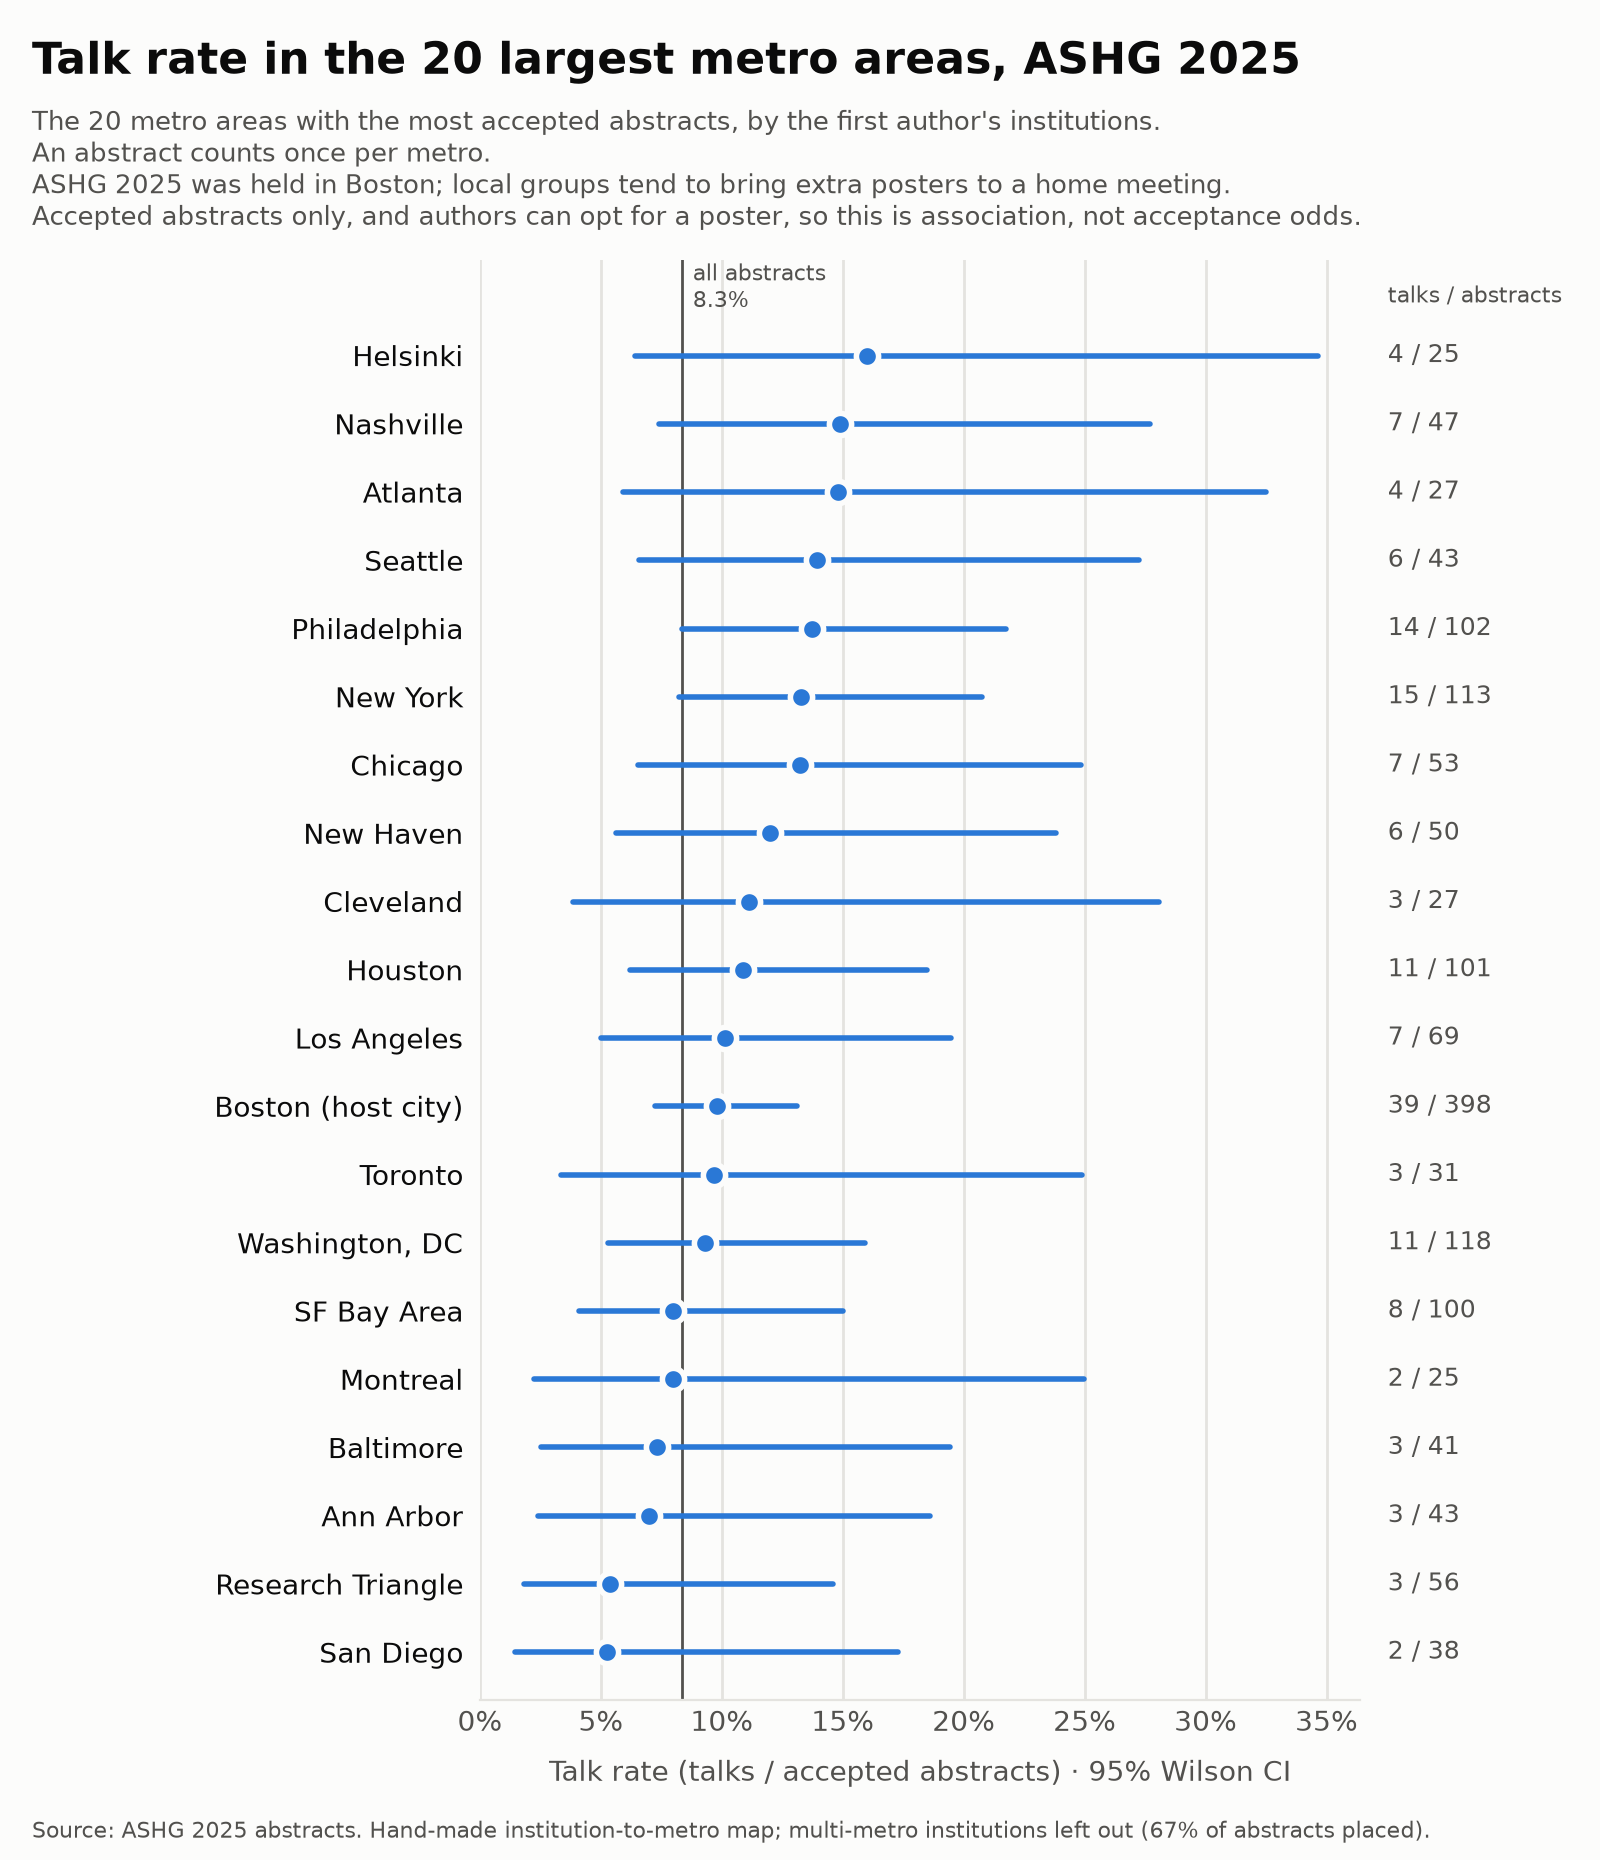
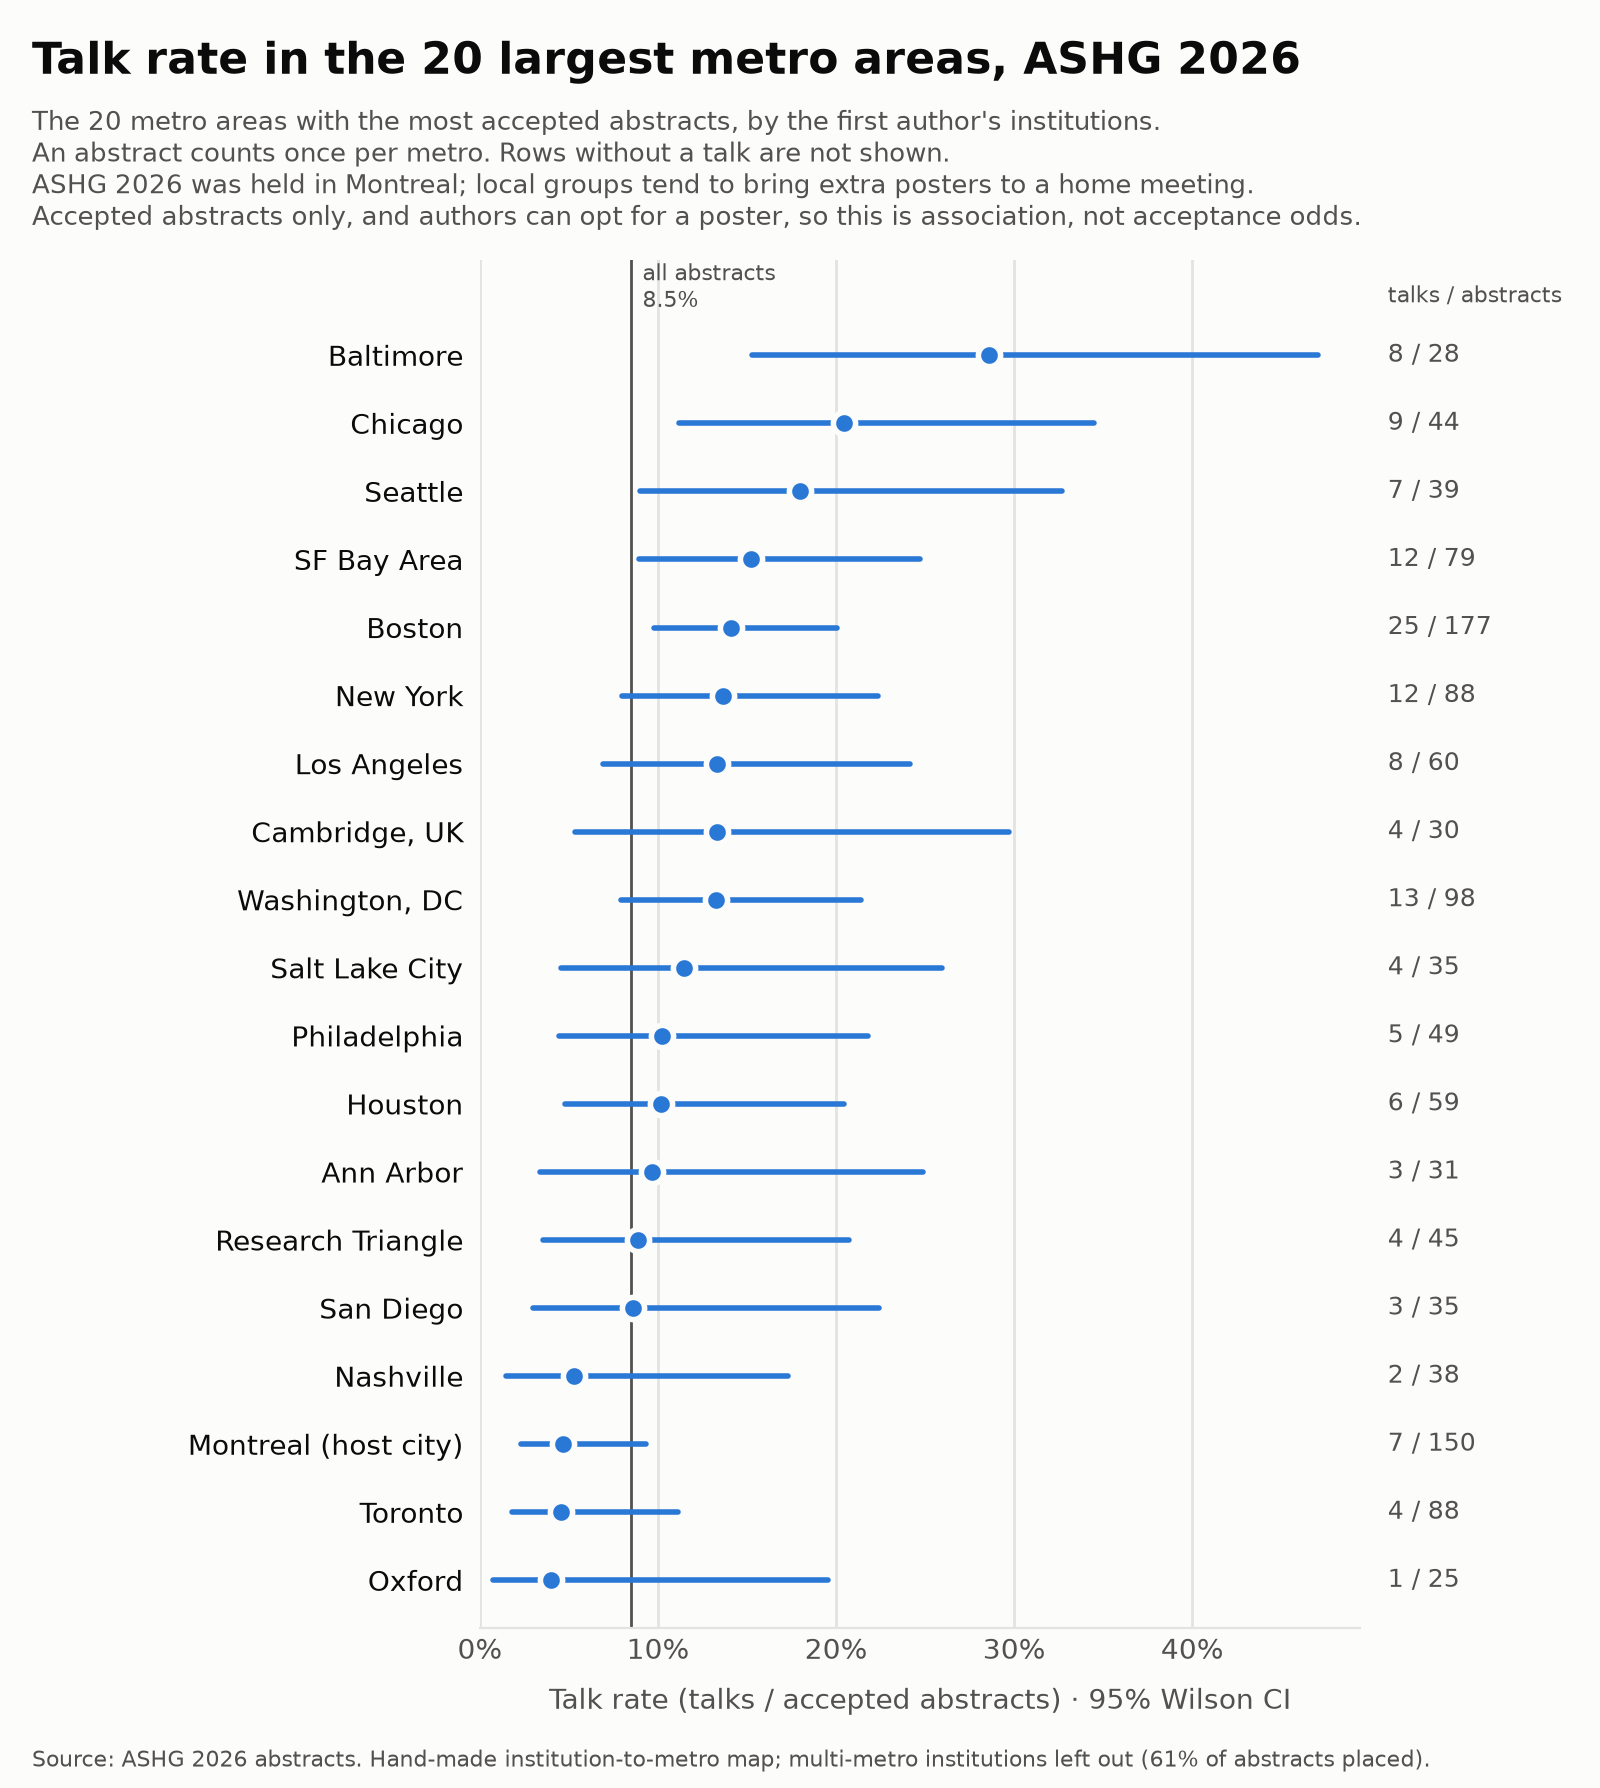
Institutions grouped by metro area: an abstract counts once per metro, however many of its institutions are there. Institutions with sites in several metros (e.g. Mayo Clinic, Penn State) are left out, as are metros without a talk. The figure shows the 20 metro areas with the most accepted abstracts. Local groups tend to bring extra posters to a home meeting.
All years, 2022–2026: 66% of abstracts have a first-author metro.
By first author
| Metro area | Largest institutions | Abstracts | Talks | Talk rate | 95% CI |
|---|---|---|---|---|---|
| Boston | Broad Institute, Harvard Medical School, Massachusetts General Hospital | 1154 | 185 | 16.0% | 14.0%–18.3% |
| Washington, DC | NIH, Vanda Pharmaceuticals, GeneDx | 617 | 65 | 10.5% | 8.4%–13.2% |
| New York | Icahn School of Medicine at Mount Sinai, Columbia University, Regeneron | 589 | 96 | 16.3% | 13.5%–19.5% |
| SF Bay Area | Stanford University, UC San Francisco, UC Berkeley | 472 | 79 | 16.7% | 13.6%–20.4% |
| Houston | Baylor College of Medicine, UTHealth Houston, MD Anderson Cancer Center | 449 | 59 | 13.1% | 10.3%–16.6% |
| Philadelphia | University of Pennsylvania, Children's Hospital of Philadelphia | 438 | 54 | 12.3% | 9.6%–15.7% |
| Los Angeles | UCLA, University of Southern California, UC Irvine | 430 | 66 | 15.3% | 12.2%–19.1% |
| Research Triangle | University of North Carolina at Chapel Hill, Duke University, RTI International | 334 | 34 | 10.2% | 7.4%–13.9% |
| Montreal | McGill University, Université de Montréal, Montreal Heart Institute | 309 | 21 | 6.8% | 4.5%–10.2% |
| Nashville | Vanderbilt University, Vanderbilt University Medical Center | 255 | 24 | 9.4% | 6.4%–13.6% |
| Toronto | University of Toronto, The Hospital for Sick Children, St. Michael's Hospital | 252 | 18 | 7.1% | 4.6%–11.0% |
| Ann Arbor | University of Michigan | 251 | 32 | 12.8% | 9.2%–17.4% |
| Chicago | University of Chicago, Northwestern University | 243 | 38 | 15.6% | 11.6%–20.7% |
| Baltimore | Johns Hopkins University, University of Maryland | 235 | 28 | 11.9% | 8.4%–16.7% |
| Seattle | University of Washington, Fred Hutchinson Cancer Center, Parse Biosciences | 219 | 31 | 14.2% | 10.2%–19.4% |
| San Diego | UC San Diego, Illumina, Rady Children's Institute for Genomic Medicine | 216 | 20 | 9.3% | 6.1%–13.9% |
| New Haven | Yale University | 173 | 16 | 9.2% | 5.8%–14.5% |
| Cleveland | Case Western Reserve University, Cleveland Clinic | 159 | 11 | 6.9% | 3.9%–12.0% |
| Atlanta | Emory University, Georgia Institute of Technology | 143 | 26 | 18.2% | 12.7%–25.3% |
| Denver | University of Colorado | 142 | 6 | 4.2% | 2.0%–8.9% |
| Seoul | Seoul National University, Sungkyunkwan University, Asan Medical Center | 132 | 6 | 4.5% | 2.1%–9.6% |
| Salt Lake City | University of Utah, Myriad Genetics | 125 | 14 | 11.2% | 6.8%–17.9% |
| Miami | University of Miami | 125 | 8 | 6.4% | 3.3%–12.1% |
| London | University College London, Imperial College London, Queen Mary University of London | 114 | 15 | 13.2% | 8.1%–20.6% |
| Helsinki | University of Helsinki | 110 | 19 | 17.3% | 11.3%–25.4% |
| Tokyo | RIKEN, University of Tokyo, Kanagawa Children's Medical Center | 110 | 10 | 9.1% | 5.0%–15.9% |
| Oxford | University of Oxford | 103 | 16 | 15.5% | 9.8%–23.8% |
| Cambridge, UK | University of Cambridge, Wellcome Sanger Institute | 100 | 15 | 15.0% | 9.3%–23.3% |
| St. Louis | Washington University in St. Louis | 92 | 11 | 12.0% | 6.8%–20.2% |
| Taipei | National Taiwan University, Academia Sinica | 87 | 4 | 4.6% | 1.8%–11.2% |
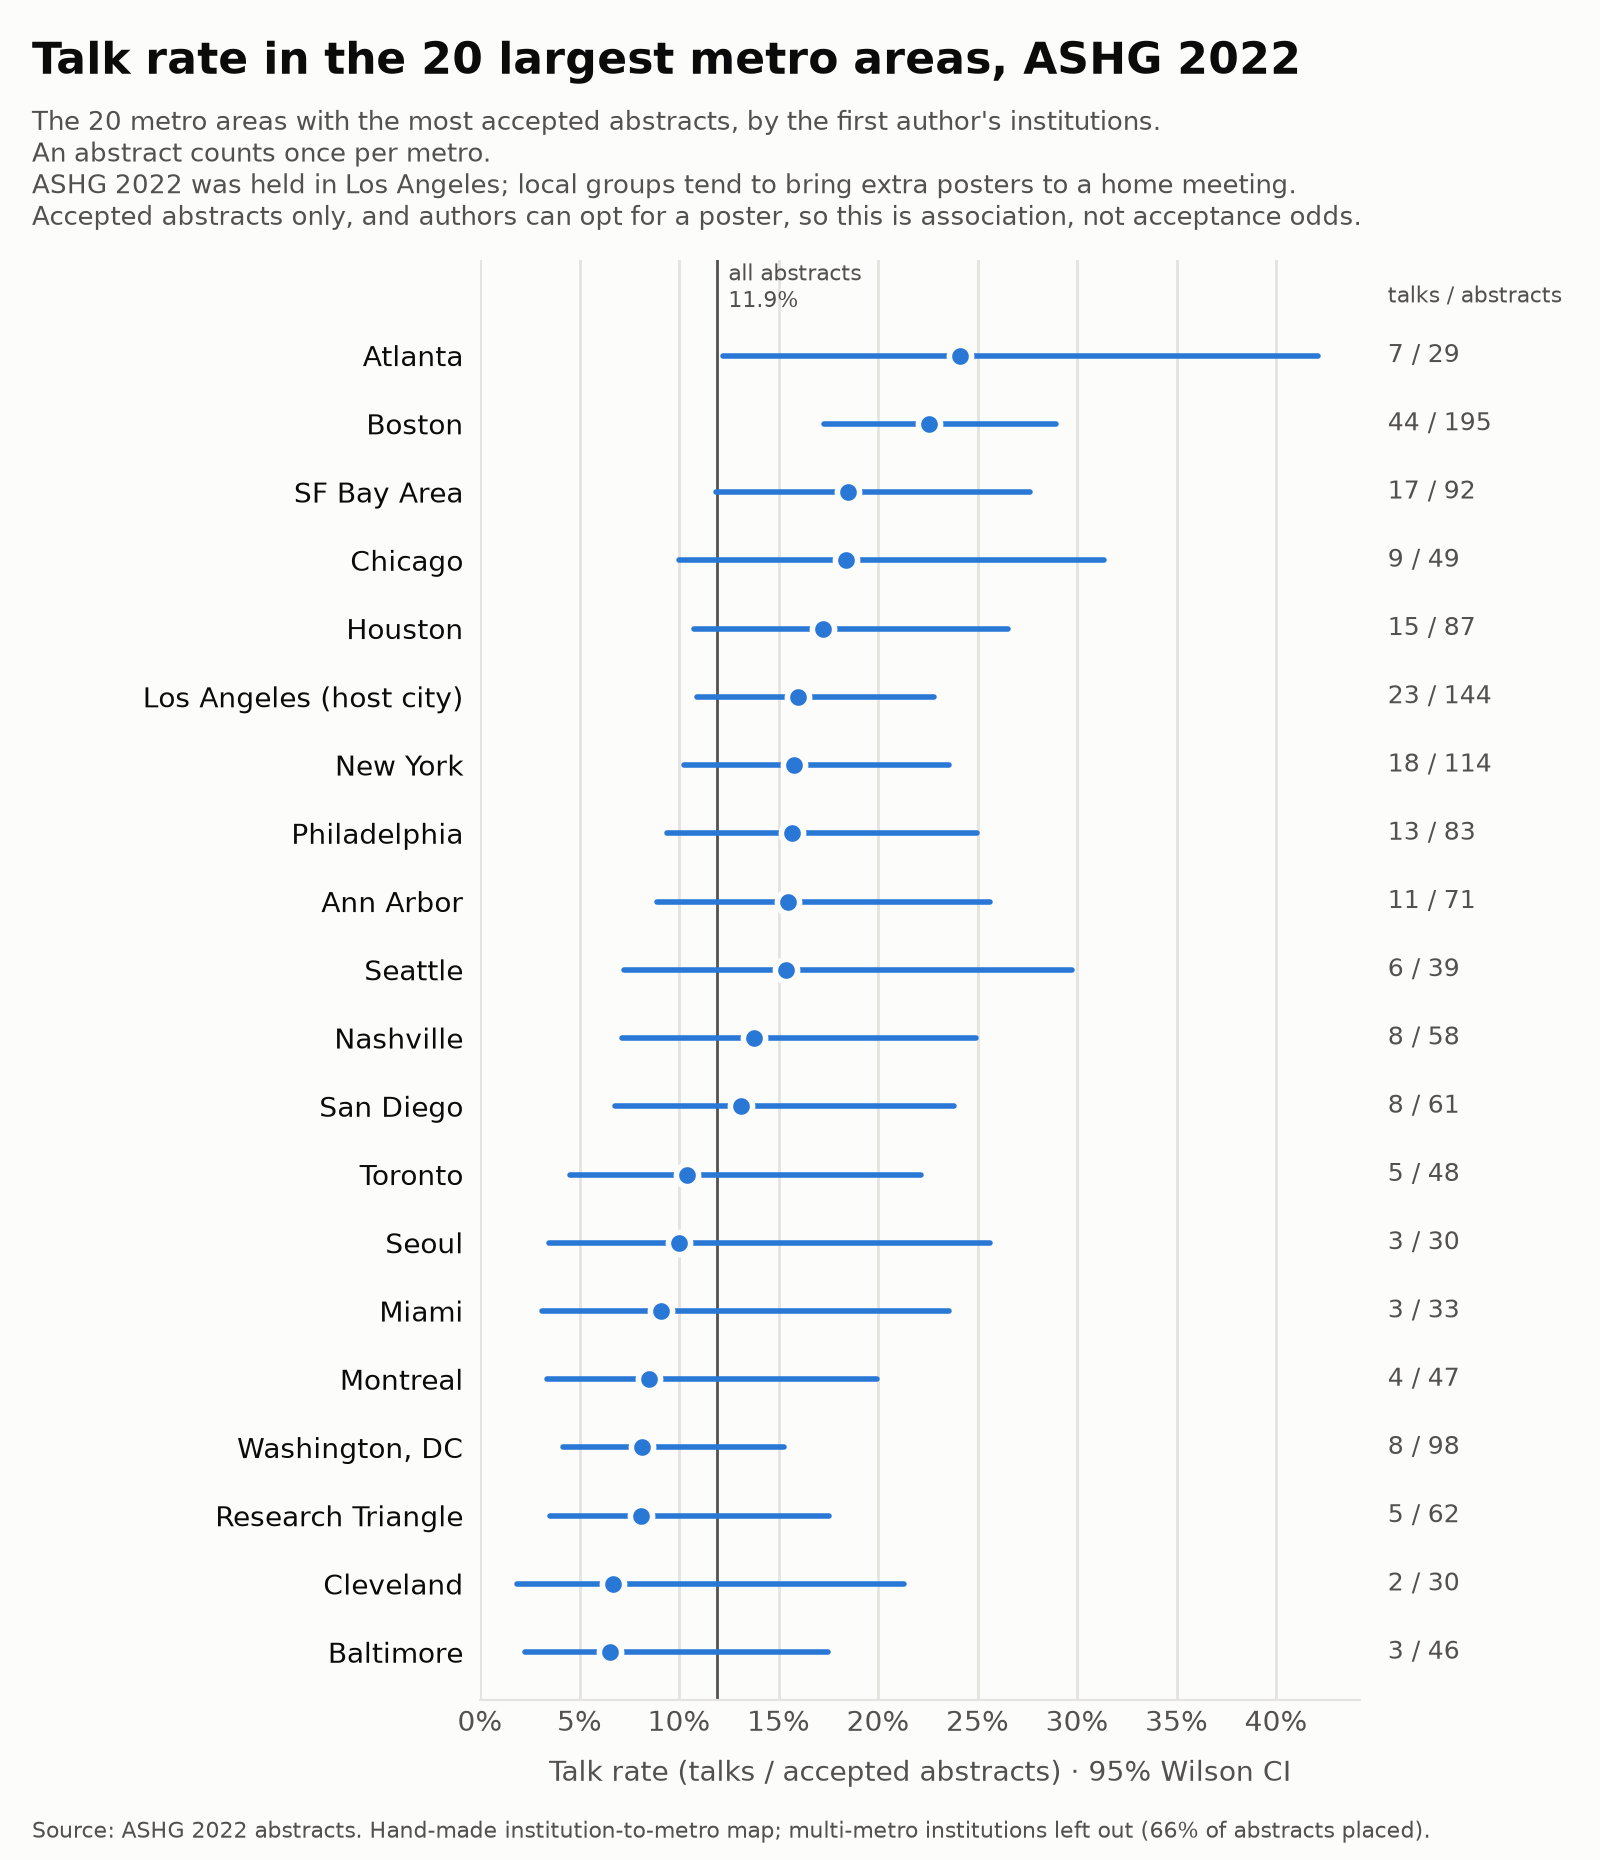
ASHG 2022 was held in Los Angeles; 66% of abstracts have a first-author metro.
By first author
| Metro area | Largest institutions | Abstracts | Talks | Talk rate | 95% CI |
|---|---|---|---|---|---|
| Boston | Broad Institute, Harvard Medical School, Massachusetts General Hospital | 195 | 44 | 22.6% | 17.3%–28.9% |
| Los Angeles | UCLA, University of Southern California, UC Irvine | 144 | 23 | 16.0% | 10.9%–22.8% |
| New York | Columbia University, Icahn School of Medicine at Mount Sinai, Regeneron | 114 | 18 | 15.8% | 10.2%–23.6% |
| Washington, DC | NIH, Vanda Pharmaceuticals, George Washington University | 98 | 8 | 8.2% | 4.2%–15.3% |
| SF Bay Area | Stanford University, UC San Francisco, UC Berkeley | 92 | 17 | 18.5% | 11.9%–27.6% |
| Houston | Baylor College of Medicine, UTHealth Houston, MD Anderson Cancer Center | 87 | 15 | 17.2% | 10.7%–26.5% |
| Philadelphia | University of Pennsylvania, Children's Hospital of Philadelphia | 83 | 13 | 15.7% | 9.4%–25.0% |
| Ann Arbor | University of Michigan | 71 | 11 | 15.5% | 8.9%–25.7% |
| Research Triangle | Duke University, University of North Carolina at Chapel Hill, RTI International | 62 | 5 | 8.1% | 3.5%–17.5% |
| San Diego | UC San Diego, Illumina, Bionano Genomics | 61 | 8 | 13.1% | 6.8%–23.8% |
| Nashville | Vanderbilt University, Vanderbilt University Medical Center | 58 | 8 | 13.8% | 7.2%–24.9% |
| Chicago | University of Chicago, Northwestern University | 49 | 9 | 18.4% | 10.0%–31.4% |
| Toronto | University of Toronto, The Hospital for Sick Children, St. Michael's Hospital | 48 | 5 | 10.4% | 4.5%–22.2% |
| Montreal | McGill University, Université de Montréal, Montreal Heart Institute | 47 | 4 | 8.5% | 3.4%–19.9% |
| Baltimore | Johns Hopkins University, University of Maryland | 46 | 3 | 6.5% | 2.2%–17.5% |
| Seattle | University of Washington, Fred Hutchinson Cancer Center, Parse Biosciences | 39 | 6 | 15.4% | 7.2%–29.7% |
| Miami | University of Miami | 33 | 3 | 9.1% | 3.1%–23.6% |
| Seoul | Seoul National University, Asan Medical Center, University of Ulsan | 30 | 3 | 10.0% | 3.5%–25.6% |
| Cleveland | Case Western Reserve University, Cleveland Clinic | 30 | 2 | 6.7% | 1.8%–21.3% |
| Atlanta | Emory University, Georgia Institute of Technology | 29 | 7 | 24.1% | 12.2%–42.1% |
| Helsinki | University of Helsinki | 28 | 7 | 25.0% | 12.7%–43.4% |
| London | University College London, Queen Mary University of London, King's College London | 25 | 2 | 8.0% | 2.2%–25.0% |
| Oxford | University of Oxford | 21 | 5 | 23.8% | 10.6%–45.1% |
| Pittsburgh | University of Pittsburgh | 20 | 1 | 5.0% | 0.9%–23.6% |
| Doha | Sidra Medicine, Hamad Bin Khalifa University | 18 | 1 | 5.6% | 1.0%–25.8% |
| Hong Kong | The Chinese University of Hong Kong, The University of Hong Kong | 18 | 1 | 5.6% | 1.0%–25.8% |
| New Haven | Yale University | 18 | 1 | 5.6% | 1.0%–25.8% |
| Brisbane | QIMR Berghofer Medical Research Institute, University of Queensland | 17 | 2 | 11.8% | 3.3%–34.3% |
| Cambridge, UK | University of Cambridge, Wellcome Sanger Institute | 16 | 1 | 6.2% | 1.1%–28.3% |
ASHG 2023 was held in Washington, DC; 67% of abstracts have a first-author metro.
By first author
| Metro area | Largest institutions | Abstracts | Talks | Talk rate | 95% CI |
|---|---|---|---|---|---|
| Boston | Broad Institute, Harvard Medical School, Harvard University | 195 | 38 | 19.5% | 14.5%–25.6% |
| Washington, DC | NIH, Vanda Pharmaceuticals, GeneDx | 188 | 19 | 10.1% | 6.6%–15.2% |
| New York | Icahn School of Medicine at Mount Sinai, Columbia University, Regeneron | 124 | 24 | 19.4% | 13.4%–27.2% |
| Houston | Baylor College of Medicine, Texas Children's Hospital, UTHealth Houston | 111 | 17 | 15.3% | 9.8%–23.2% |
| SF Bay Area | Stanford University, UC San Francisco, 23andMe | 98 | 16 | 16.3% | 10.3%–24.9% |
| Philadelphia | University of Pennsylvania, Children's Hospital of Philadelphia | 97 | 8 | 8.2% | 4.2%–15.4% |
| Research Triangle | University of North Carolina at Chapel Hill, Duke University, RTI International | 90 | 10 | 11.1% | 6.1%–19.3% |
| Baltimore | Johns Hopkins University, University of Maryland | 86 | 11 | 12.8% | 7.3%–21.5% |
| Los Angeles | UCLA, University of Southern California, UC Irvine | 83 | 12 | 14.5% | 8.5%–23.6% |
| Nashville | Vanderbilt University, Vanderbilt University Medical Center | 58 | 4 | 6.9% | 2.7%–16.4% |
| Ann Arbor | University of Michigan | 50 | 6 | 12.0% | 5.6%–23.8% |
| Toronto | University of Toronto, The Hospital for Sick Children, St. Michael's Hospital | 49 | 3 | 6.1% | 2.1%–16.5% |
| Chicago | University of Chicago, Northwestern University | 44 | 7 | 15.9% | 7.9%–29.4% |
| Seattle | University of Washington, Fred Hutchinson Cancer Center, Pacific Northwest Research Institute | 44 | 6 | 13.6% | 6.4%–26.7% |
| Montreal | McGill University, Université de Montréal, Montreal Heart Institute | 44 | 3 | 6.8% | 2.3%–18.2% |
| New Haven | Yale University | 43 | 5 | 11.6% | 5.1%–24.5% |
| Cleveland | Case Western Reserve University, Cleveland Clinic | 41 | 1 | 2.4% | 0.4%–12.6% |
| San Diego | UC San Diego, Bionano Genomics, Rady Children's Institute for Genomic Medicine | 39 | 6 | 15.4% | 7.2%–29.7% |
| Atlanta | Emory University, Georgia Institute of Technology | 37 | 7 | 18.9% | 9.5%–34.2% |
| Seoul | Seoul National University, Sungkyunkwan University, University of Ulsan | 33 | 2 | 6.1% | 1.7%–19.6% |
| London | University College London, Imperial College London, King's College London | 29 | 4 | 13.8% | 5.5%–30.6% |
| Miami | University of Miami | 28 | 2 | 7.1% | 2.0%–22.7% |
| Tokyo | RIKEN, University of Tokyo, Kanagawa Children's Medical Center | 27 | 2 | 7.4% | 2.1%–23.4% |
| St. Louis | Washington University in St. Louis | 26 | 3 | 11.5% | 4.0%–29.0% |
| Oxford | University of Oxford | 23 | 4 | 17.4% | 7.0%–37.1% |
| Pittsburgh | University of Pittsburgh | 23 | 3 | 13.0% | 4.5%–32.1% |
| Salt Lake City | University of Utah, Myriad Genetics | 22 | 6 | 27.3% | 13.2%–48.1% |
| Hong Kong | The University of Hong Kong, The Chinese University of Hong Kong | 21 | 1 | 4.8% | 0.8%–22.7% |
| Cambridge, UK | University of Cambridge, Wellcome Sanger Institute | 20 | 4 | 20.0% | 8.1%–41.6% |
| Helsinki | University of Helsinki | 20 | 3 | 15.0% | 5.2%–36.0% |
ASHG 2024 was held in Denver; 68% of abstracts have a first-author metro.
By first author
| Metro area | Largest institutions | Abstracts | Talks | Talk rate | 95% CI |
|---|---|---|---|---|---|
| Boston | Broad Institute, Harvard Medical School, Massachusetts General Hospital | 189 | 39 | 20.6% | 15.5%–27.0% |
| New York | Icahn School of Medicine at Mount Sinai, Columbia University, Regeneron | 150 | 27 | 18.0% | 12.7%–24.9% |
| Washington, DC | NIH, Vanda Pharmaceuticals, George Washington University | 115 | 14 | 12.2% | 7.4%–19.4% |
| Philadelphia | University of Pennsylvania, Children's Hospital of Philadelphia | 107 | 14 | 13.1% | 8.0%–20.8% |
| SF Bay Area | Stanford University, UC San Francisco, Invitae | 103 | 26 | 25.2% | 17.8%–34.4% |
| Houston | Baylor College of Medicine, MD Anderson Cancer Center, UTHealth Houston | 91 | 10 | 11.0% | 6.1%–19.1% |
| Research Triangle | University of North Carolina at Chapel Hill, Duke University, RTI International | 81 | 12 | 14.8% | 8.7%–24.1% |
| Los Angeles | UCLA, University of Southern California, Cedars-Sinai Medical Center | 74 | 16 | 21.6% | 13.8%–32.3% |
| Denver | University of Colorado | 65 | 4 | 6.2% | 2.4%–14.8% |
| Ann Arbor | University of Michigan | 56 | 9 | 16.1% | 8.7%–27.8% |
| Seattle | University of Washington, Fred Hutchinson Cancer Center, Parse Biosciences | 54 | 6 | 11.1% | 5.2%–22.2% |
| Nashville | Vanderbilt University Medical Center, Vanderbilt University | 54 | 3 | 5.6% | 1.9%–15.1% |
| Chicago | University of Chicago, Northwestern University | 53 | 6 | 11.3% | 5.3%–22.6% |
| Montreal | McGill University, Université de Montréal, Montreal Heart Institute | 43 | 5 | 11.6% | 5.1%–24.5% |
| San Diego | UC San Diego, Illumina, Rady Children's Institute for Genomic Medicine | 43 | 1 | 2.3% | 0.4%–12.1% |
| Cleveland | Case Western Reserve University, Cleveland Clinic | 39 | 3 | 7.7% | 2.7%–20.3% |
| Toronto | University of Toronto, The Hospital for Sick Children, St. Michael's Hospital | 36 | 3 | 8.3% | 2.9%–21.8% |
| Baltimore | Johns Hopkins University, University of Maryland | 34 | 3 | 8.8% | 3.0%–23.0% |
| Salt Lake City | University of Utah, Myriad Genetics | 34 | 3 | 8.8% | 3.0%–23.0% |
| New Haven | Yale University | 30 | 4 | 13.3% | 5.3%–29.7% |
| Atlanta | Emory University, Georgia Institute of Technology | 27 | 6 | 22.2% | 10.6%–40.8% |
| Miami | University of Miami | 27 | 2 | 7.4% | 2.1%–23.4% |
| Tokyo | RIKEN, University of Tokyo, Kanagawa Children's Medical Center | 26 | 1 | 3.8% | 0.7%–18.9% |
| Seoul | Seoul National University, Sungkyunkwan University | 24 | 1 | 4.2% | 0.7%–20.2% |
| London | University College London, King's College London, Imperial College London | 21 | 3 | 14.3% | 5.0%–34.6% |
| Taipei | National Taiwan University, Academia Sinica | 19 | 1 | 5.3% | 0.9%–24.6% |
| Oxford | University of Oxford | 16 | 4 | 25.0% | 10.2%–49.5% |
| Helsinki | University of Helsinki | 16 | 3 | 18.8% | 6.6%–43.0% |
| Minneapolis | University of Minnesota | 16 | 2 | 12.5% | 3.5%–36.0% |
ASHG 2025 was held in Boston; 67% of abstracts have a first-author metro.
By first author
| Metro area | Largest institutions | Abstracts | Talks | Talk rate | 95% CI |
|---|---|---|---|---|---|
| Boston | Broad Institute, Harvard Medical School, Massachusetts General Hospital | 398 | 39 | 9.8% | 7.3%–13.1% |
| Washington, DC | NIH, GeneDx, Vanda Pharmaceuticals | 118 | 11 | 9.3% | 5.3%–15.9% |
| New York | Icahn School of Medicine at Mount Sinai, Columbia University, NYU Langone Health | 113 | 15 | 13.3% | 8.2%–20.8% |
| Philadelphia | University of Pennsylvania, Children's Hospital of Philadelphia | 102 | 14 | 13.7% | 8.4%–21.7% |
| Houston | Baylor College of Medicine, UTHealth Houston, MD Anderson Cancer Center | 101 | 11 | 10.9% | 6.2%–18.5% |
| SF Bay Area | Stanford University, UC San Francisco, Helix | 100 | 8 | 8.0% | 4.1%–15.0% |
| Los Angeles | UCLA, University of Southern California, Cedars-Sinai Medical Center | 69 | 7 | 10.1% | 5.0%–19.5% |
| Research Triangle | University of North Carolina at Chapel Hill, Duke University, BioSkryb Genomics | 56 | 3 | 5.4% | 1.8%–14.6% |
| Chicago | University of Chicago, Northwestern University | 53 | 7 | 13.2% | 6.5%–24.8% |
| New Haven | Yale University | 50 | 6 | 12.0% | 5.6%–23.8% |
| Nashville | Vanderbilt University Medical Center, Vanderbilt University | 47 | 7 | 14.9% | 7.4%–27.7% |
| Seattle | University of Washington, Parse Biosciences, Fred Hutchinson Cancer Center | 43 | 6 | 14.0% | 6.6%–27.3% |
| Ann Arbor | University of Michigan | 43 | 3 | 7.0% | 2.4%–18.6% |
| Baltimore | Johns Hopkins University, University of Maryland | 41 | 3 | 7.3% | 2.5%–19.4% |
| San Diego | UC San Diego, Illumina, Rady Children's Institute for Genomic Medicine | 38 | 2 | 5.3% | 1.5%–17.3% |
| Toronto | University of Toronto, The Hospital for Sick Children, Ontario Institute for Cancer Research | 31 | 3 | 9.7% | 3.3%–24.9% |
| Atlanta | Emory University, Georgia Institute of Technology | 27 | 4 | 14.8% | 5.9%–32.5% |
| Cleveland | Case Western Reserve University, Cleveland Clinic | 27 | 3 | 11.1% | 3.9%–28.1% |
| Helsinki | University of Helsinki | 25 | 4 | 16.0% | 6.4%–34.6% |
| Montreal | McGill University, Université de Montréal, Montreal Heart Institute | 25 | 2 | 8.0% | 2.2%–25.0% |
| Denver | University of Colorado | 24 | 1 | 4.2% | 0.7%–20.2% |
| Miami | University of Miami | 24 | 1 | 4.2% | 0.7%–20.2% |
| Tokyo | RIKEN, University of Tokyo, Kanagawa Children's Medical Center | 23 | 3 | 13.0% | 4.5%–32.1% |
| Taipei | National Taiwan University, Academia Sinica | 22 | 1 | 4.5% | 0.8%–21.8% |
| Cambridge, UK | University of Cambridge, Wellcome Sanger Institute | 21 | 2 | 9.5% | 2.7%–28.9% |
| Hong Kong | The University of Hong Kong, The Chinese University of Hong Kong | 20 | 2 | 10.0% | 2.8%–30.1% |
| London | University College London, Imperial College London, Queen Mary University of London | 19 | 4 | 21.1% | 8.5%–43.3% |
| Oxford | University of Oxford | 18 | 2 | 11.1% | 3.1%–32.8% |
| Cincinnati | Cincinnati Children's Hospital Medical Center, University of Cincinnati | 17 | 2 | 11.8% | 3.3%–34.3% |
ASHG 2026 was held in Montreal; 61% of abstracts have a first-author metro.
By first author
| Metro area | Largest institutions | Abstracts | Talks | Talk rate | 95% CI |
|---|---|---|---|---|---|
| Boston | Broad Institute, Harvard Medical School, Massachusetts General Hospital | 177 | 25 | 14.1% | 9.8%–20.0% |
| Montreal | McGill University, Université de Montréal, Montreal Heart Institute | 150 | 7 | 4.7% | 2.3%–9.3% |
| Washington, DC | NIH, GeneDx, Vanda Pharmaceuticals | 98 | 13 | 13.3% | 7.9%–21.4% |
| New York | Icahn School of Medicine at Mount Sinai, Columbia University, New York Genome Center | 88 | 12 | 13.6% | 8.0%–22.3% |
| Toronto | University of Toronto, The Hospital for Sick Children, Ontario Institute for Cancer Research | 88 | 4 | 4.5% | 1.8%–11.1% |
| SF Bay Area | Stanford University, UC San Francisco, Helix | 79 | 12 | 15.2% | 8.9%–24.7% |
| Los Angeles | UCLA, University of Southern California, UC Irvine | 60 | 8 | 13.3% | 6.9%–24.2% |
| Houston | Baylor College of Medicine, Texas Children's Hospital, UTHealth Houston | 59 | 6 | 10.2% | 4.7%–20.5% |
| Philadelphia | University of Pennsylvania, Children's Hospital of Philadelphia | 49 | 5 | 10.2% | 4.4%–21.8% |
| Research Triangle | University of North Carolina at Chapel Hill, Duke University, RTI International | 45 | 4 | 8.9% | 3.5%–20.7% |
| Chicago | University of Chicago, Northwestern University | 44 | 9 | 20.4% | 11.2%–34.5% |
| Seattle | University of Washington, Fred Hutchinson Cancer Center, Pacific Northwest Research Institute | 39 | 7 | 17.9% | 9.0%–32.7% |
| Nashville | Vanderbilt University, Vanderbilt University Medical Center | 38 | 2 | 5.3% | 1.5%–17.3% |
| Salt Lake City | University of Utah, Myriad Genetics | 35 | 4 | 11.4% | 4.5%–25.9% |
| San Diego | UC San Diego, Illumina, Empirico | 35 | 3 | 8.6% | 3.0%–22.4% |
| Ann Arbor | University of Michigan | 31 | 3 | 9.7% | 3.3%–24.9% |
| Cambridge, UK | University of Cambridge, Wellcome Sanger Institute | 30 | 4 | 13.3% | 5.3%–29.7% |
| Baltimore | Johns Hopkins University, University of Maryland | 28 | 8 | 28.6% | 15.2%–47.1% |
| Oxford | University of Oxford | 25 | 1 | 4.0% | 0.7%–19.5% |
| Tokyo | University of Tokyo, RIKEN, Kanagawa Children's Medical Center | 24 | 3 | 12.5% | 4.3%–31.0% |
| Vancouver | University of British Columbia | 24 | 1 | 4.2% | 0.7%–20.2% |
| Atlanta | Emory University, Georgia Institute of Technology | 23 | 2 | 8.7% | 2.4%–26.8% |
| Cleveland | Case Western Reserve University, Cleveland Clinic | 22 | 2 | 9.1% | 2.5%–27.8% |
| Helsinki | University of Helsinki | 21 | 2 | 9.5% | 2.7%–28.9% |
| Taipei | National Taiwan University, Academia Sinica | 21 | 1 | 4.8% | 0.8%–22.7% |
| London | King's College London, University College London, Queen Mary University of London | 20 | 2 | 10.0% | 2.8%–30.1% |
| St. Louis | Washington University in St. Louis | 19 | 3 | 15.8% | 5.5%–37.6% |