This site parses the abstracts published for the American Society of Human Genetics annual meeting
(2022–2026: 15,327 abstracts) and
asks which topics and wording are rising or fading, who presents, and which phrases, institutions and places are
overrepresented among the few hundred abstracts a year chosen for talks; the rest become posters.
Read this first. Only accepted abstracts are published, and authors can
request a poster, so “talk rate” is the fraction of accepted abstracts presented as talks, not an acceptance rate or
a quality score. Every number is an association, not a recipe for getting a talk. Not every affiliation could be
matched: see the match rates.
1Search a phrase
Type a word or phrase to see how often talks and posters mention it each year, then which first-author institutions
and metro areas write about it. Hover or focus a row for that institution's own mention rate and odds of a talk.
Plot
share of talksshare of posters
Odds of a talk with vs without it each year, with 95% CIs; above 1× it is more common in talks.
No institution or metro breakdown for this phrase: that is kept for the phrases listed before you search.
Who writes about itBars
talksposters
Odds of a talk for that institution's (or metro's) abstracts with vs without it, as for the phrase overall above: dot and 95% CI, log scale; the dashed line is 1×, no difference. Few abstracts make for wide intervals.
Five shifts in what ASHG abstracts mention, 2022–2026. Scroll through them; the
chart shows the share of each year's accepted abstracts that mention a topic.
Long reads and proteomics keep growing
long-read is in 8.7% of 2026 abstracts, up from 4.1% in
2022. proteomics rose from 2.5% to 6.4%, and
pangenome from 0.3% to 1.7%.
Share of each year's accepted abstracts mentioning the topic (title or text; spelling variants
and abbreviations count). Click a topic to look it up in talks and posters.
For each phrase of one to three words, we compare the odds of a talk (versus a poster) among abstracts
that mention it and those that don't. Above 1×, the phrase is overrepresented in talks. A few from 2026:
Four 2026 phrases that lean toward talks, sorted by odds of a talk with versus without the
phrase; log scale, dashed line = 1× (as common in talks as in posters). Few abstracts make for wide intervals. Click a
phrase to look it up.
Clinical work stopped leaning toward posters. Through 2025,
“patients”, “likely pathogenic” and “diagnosis” came up more often in posters than in talks; in 2026 they were at least as common in talks.
Each row on its own scale. These phrases were picked before looking at 2026, but across
every phrase tested no single shift survives a false-discovery-rate correction: suggestive,
not established.
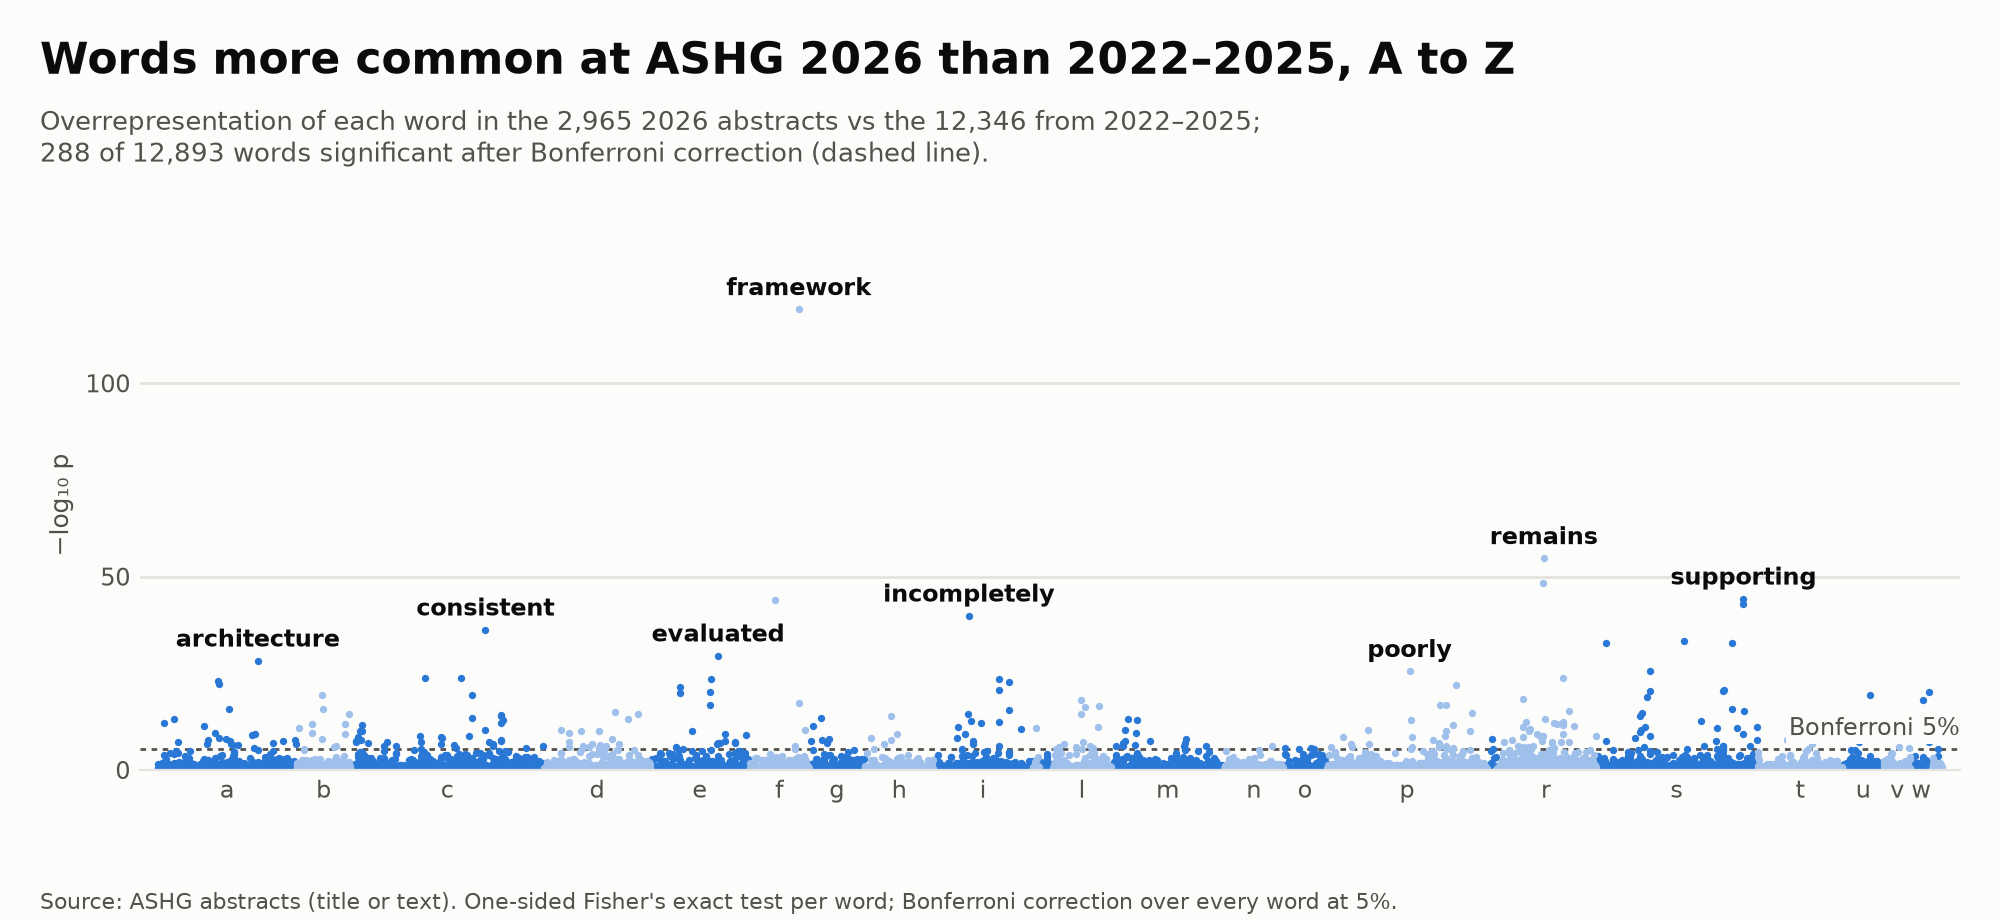
“framework” is in 27% of 2026 abstracts, up from
10% in 2022–2025. It is one of 288 words
significantly more common in 2026, and most of them are general wording rather than new topics.
How this differs from the sections above. Those look at hand-picked or talk-leaning phrases.
This one tests every single word, comparing 2026 with 2022–2025, whatever
the topic and whether it was a talk or a poster.
Every word, alphabetically, by how strongly it is overrepresented in 2026 (p from a one-sided Fisher's exact test per word); dashed line: Bonferroni correction. Hover a point for its word, click it to look it up.
Word
2026 abstracts
2022–2025 abstracts
Odds ratio
p
Every word in the figure, the most overrepresented first; scroll the table for more, click a heading to sort. Bold p:
significant after Bonferroni correction. A word less common in 2026 has an odds ratio below 1 and p near 1.
Among the 50 institutions with the most first-author abstracts (2022–2026),
Regeneron, MIT and Massachusetts General Hospital lead, at 23%–25%
of abstracts given a talk, against 10.1% overall.
Institution
Talks / abstracts
Talk rate · 95% CI
Regeneron
17 / 68
25.0%
MIT
13 / 53
24.5%
Massachusetts General Hospital
56 / 243
23.1%
Icahn School of Medicine at Mount Sinai
42 / 212
19.8%
UCLA
35 / 187
18.7%
Broad Institute
82 / 447
18.3%
First author's institutions; dashed line = all abstracts (10.1%). Smaller
institutions have wide intervals. In 2026 alone, Johns Hopkins University, University of Chicago, Icahn School of Medicine at Mount Sinai had the highest rates.